Fig. A.1.
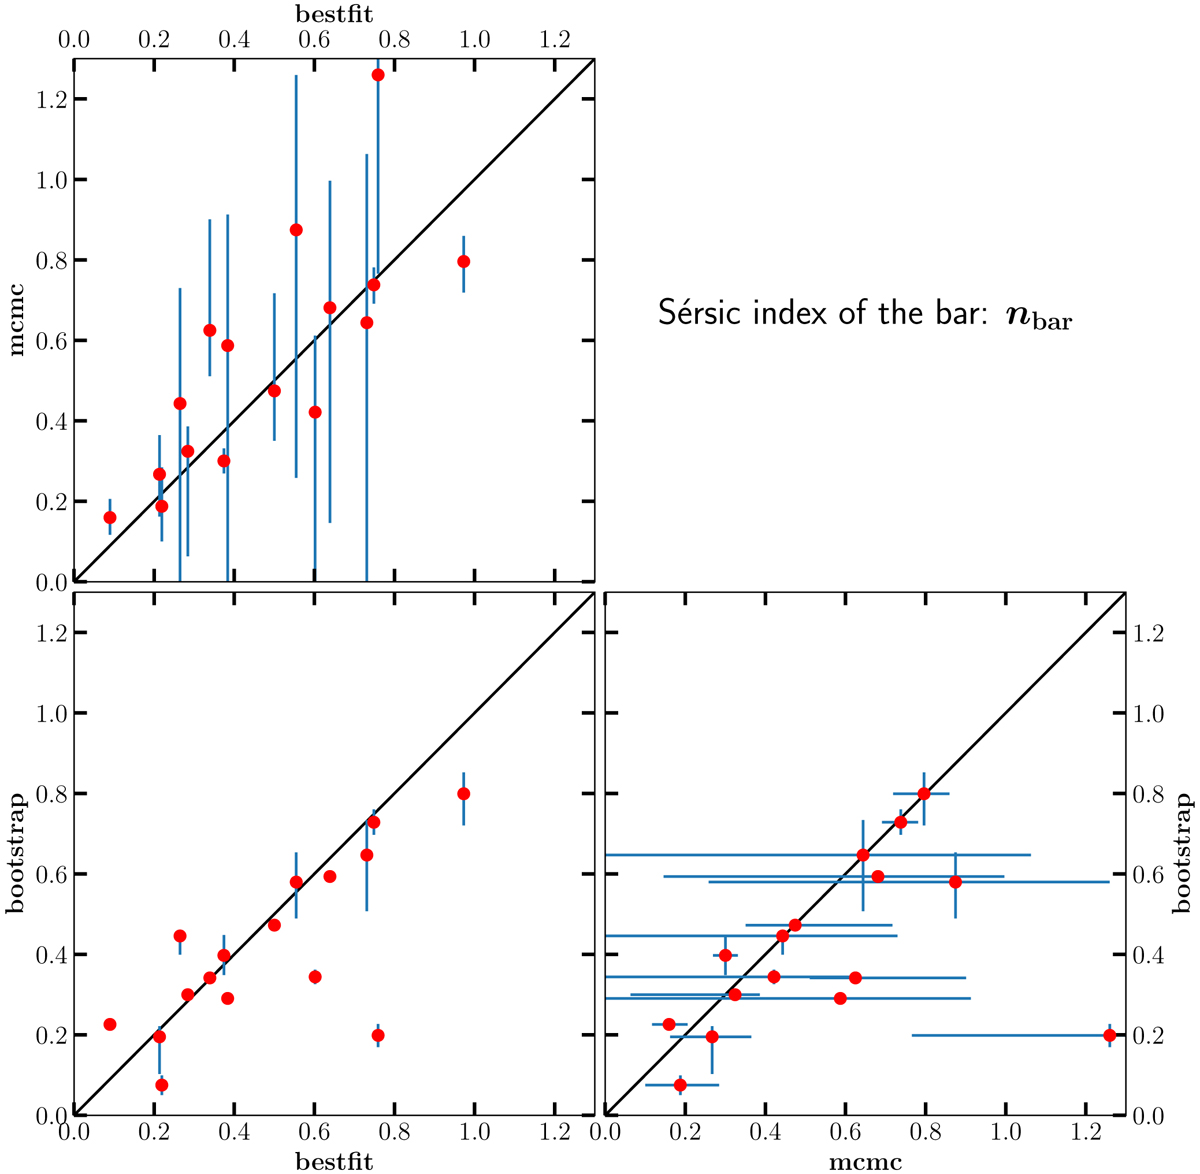
Comparison between different methods to fit multicomponent galaxy models to the collapsed 2D MUSE i-band images. This plot only shows results for the parameter nbar. The label best fit is the best fitting result using the Nelder-Mead simplex minimisation technique and a χ2 fit statistic for minimisation. The label bootstrap gives the result of resampling the pixel values in the data image with 1000 iterations after the best fit. For time-saving reasons it uses the Levenberg-Marquardt minimisation algorithm. The red data points given in the plot indicate the median value of the 1000 fits; the error bars show the 0.16 and 0.84 quantiles. The label mcmc is the result of applying a MCMC analysis to the data image instead of searching for the best fit model. The data points in the plot indicate again the median value of the posterior distribution; the error bars show the 0.16 and 0.84 quantiles.
Current usage metrics show cumulative count of Article Views (full-text article views including HTML views, PDF and ePub downloads, according to the available data) and Abstracts Views on Vision4Press platform.
Data correspond to usage on the plateform after 2015. The current usage metrics is available 48-96 hours after online publication and is updated daily on week days.
Initial download of the metrics may take a while.