Fig. 12.
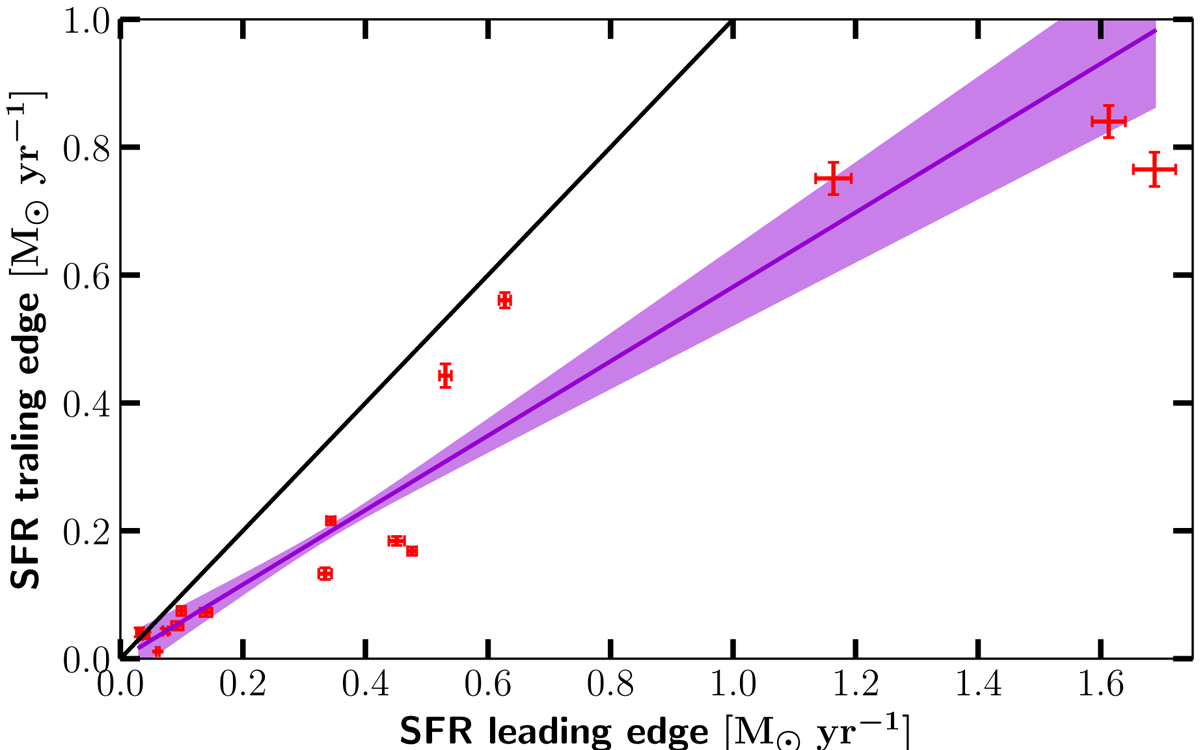
Comparison between the SFR on the leading and on the trailing edge of the bar. The black solid line shows a hypothetical one-to-one correlation. The data suggest a linear correlation that was tested with the Pearson correlation coefficient that yields ρ = 0.96 ± 0.01. The violet solid line shows a linear regression of the form y = m ⋅ x + c with the parameter estimates m = 0.58 ± 0.09 and c = 0.00 ± 0.01. On average, the SFR is stronger on the leading edge of the bar by a factor of 1.76.
Current usage metrics show cumulative count of Article Views (full-text article views including HTML views, PDF and ePub downloads, according to the available data) and Abstracts Views on Vision4Press platform.
Data correspond to usage on the plateform after 2015. The current usage metrics is available 48-96 hours after online publication and is updated daily on week days.
Initial download of the metrics may take a while.