Fig. 11.
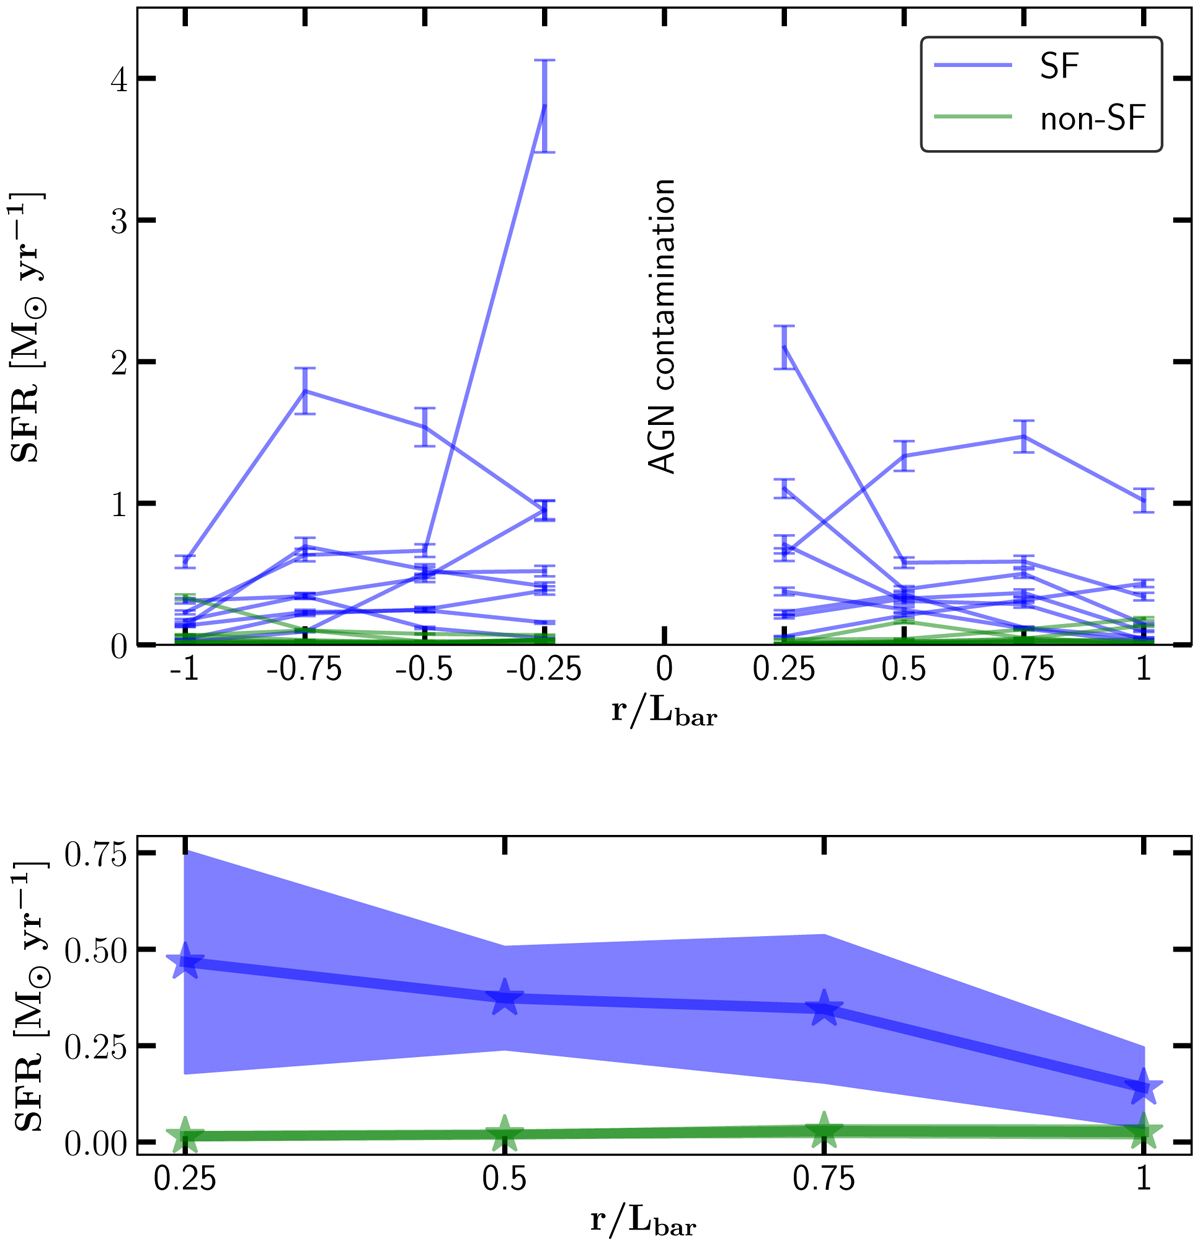
Upper panel: distribution of the SFRs across the bar parallel to the bar major axis. Each data point shows the integrated SFR (y-axis) within the corresponding row (x-axis) in the bar mask as indicated in Fig. 5. Each line corresponds to one object. The SF bars are shown in blue and non-SF bars are indicated in green. The central row is not shown since the SFR is very uncertain, because of over or under subtraction of AGN contamination. Lower panel: median of both sides of the bar and all objects within each category. The shaded regions show the median average deviation (MAD). On average, the SFR of SF bars is decreasing with distance.
Current usage metrics show cumulative count of Article Views (full-text article views including HTML views, PDF and ePub downloads, according to the available data) and Abstracts Views on Vision4Press platform.
Data correspond to usage on the plateform after 2015. The current usage metrics is available 48-96 hours after online publication and is updated daily on week days.
Initial download of the metrics may take a while.