Fig. 1.
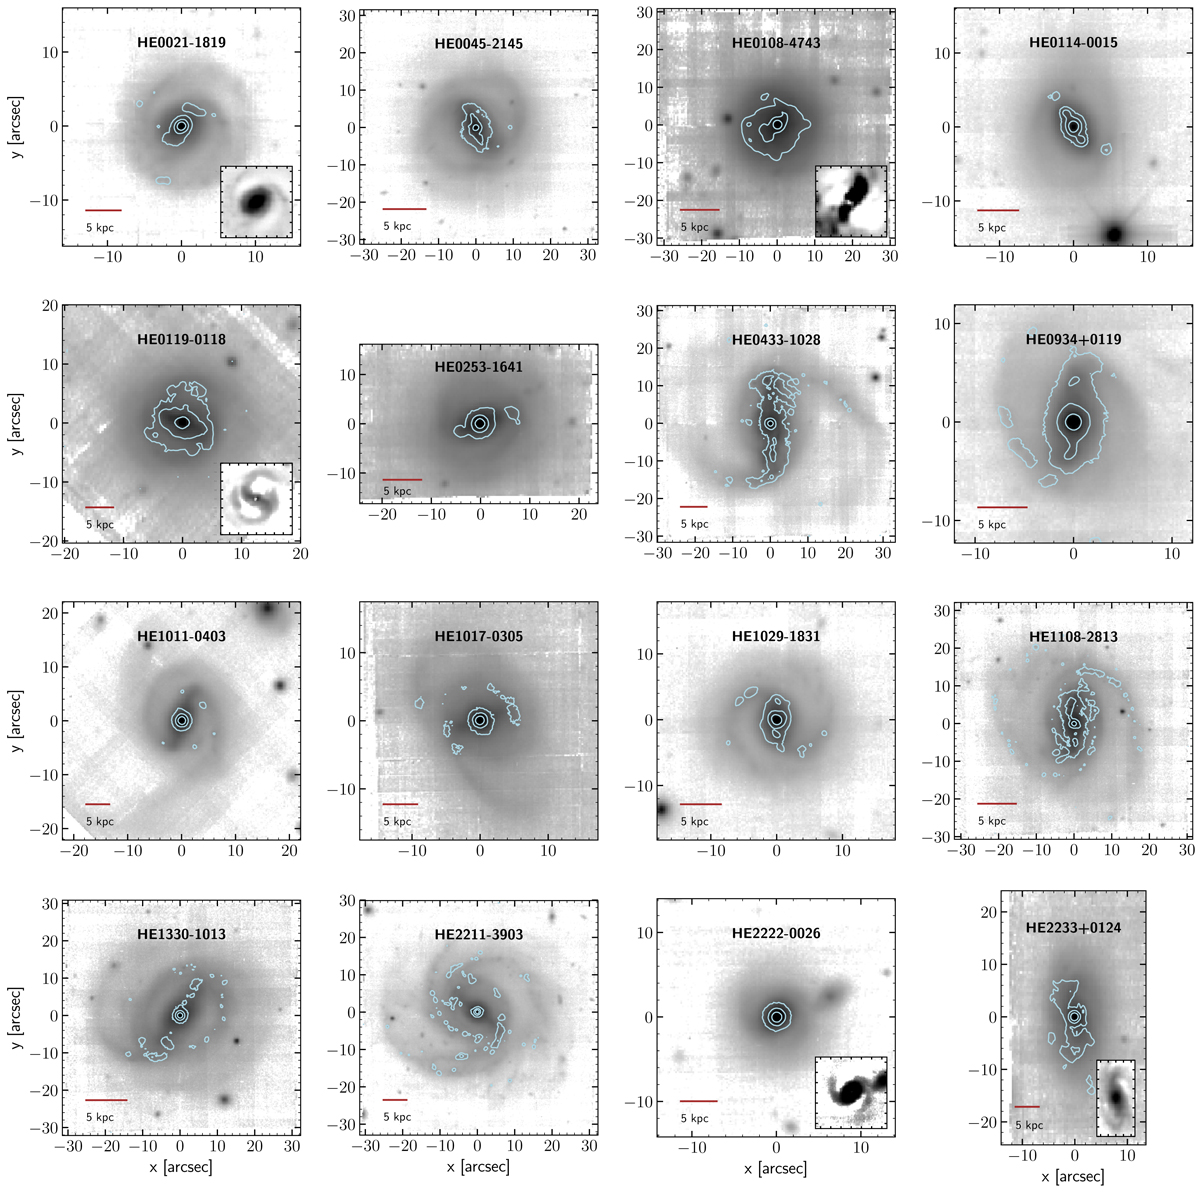
MUSE collapsed i-band images overlaid with contours of continuum subtracted Hα emission from the original data cubes (AGN+host). This figure shows our complete sample. Inset plots are added for galaxies where bars are difficult to recognise. These inset plots present residual images when subtracting a simple point source + exponential disc model from the galaxy.
Current usage metrics show cumulative count of Article Views (full-text article views including HTML views, PDF and ePub downloads, according to the available data) and Abstracts Views on Vision4Press platform.
Data correspond to usage on the plateform after 2015. The current usage metrics is available 48-96 hours after online publication and is updated daily on week days.
Initial download of the metrics may take a while.