Fig. 5
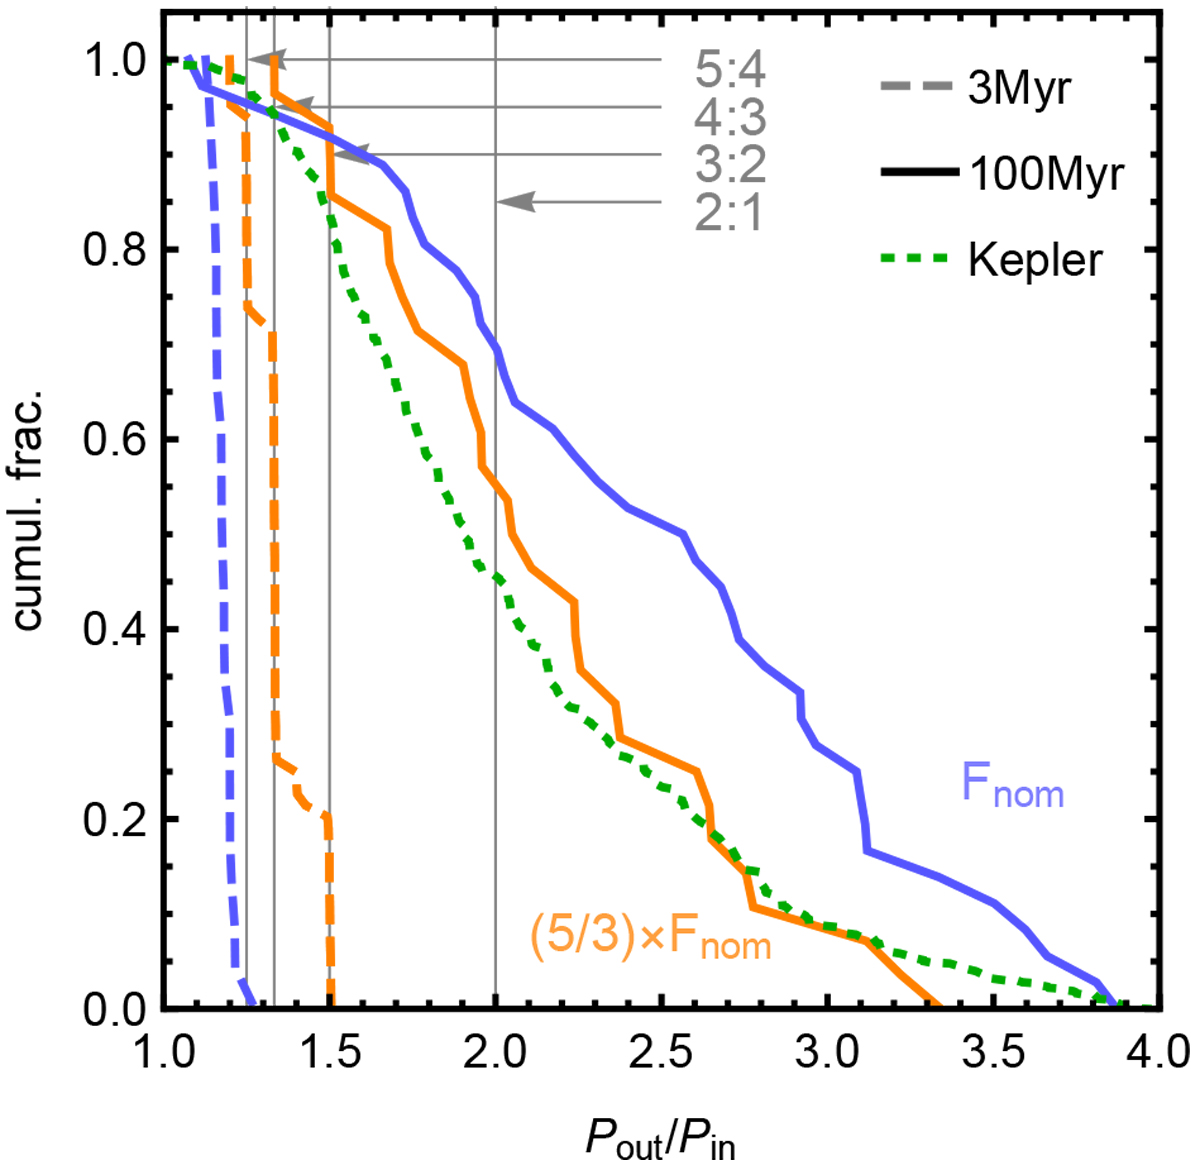
Cumulative distribution of neighbouring planet pairs. Dashed curves show the situation after the end of the gas disc phase (t = 3 Myr), for both simulations suites runf3 (blue) and runf5 (orange). The full lines show the situation after 100 Myr of additional evolution. For the super-Earth systems most resonant pairs do not survive the post-gas phase. The vertical grey thin lines show the period ratios corresponding to, from left to right, the 5: 4, 4: 3, 3:2, 2:1 first-order mean-motion resonances. For comparison, the green short-dashed curve shows the observed period ratio distribution of the Kepler multi-planet systems, limited to a maximal period ratio of Pout ∕Pin = 4.
Current usage metrics show cumulative count of Article Views (full-text article views including HTML views, PDF and ePub downloads, according to the available data) and Abstracts Views on Vision4Press platform.
Data correspond to usage on the plateform after 2015. The current usage metrics is available 48-96 hours after online publication and is updated daily on week days.
Initial download of the metrics may take a while.