Fig. 2
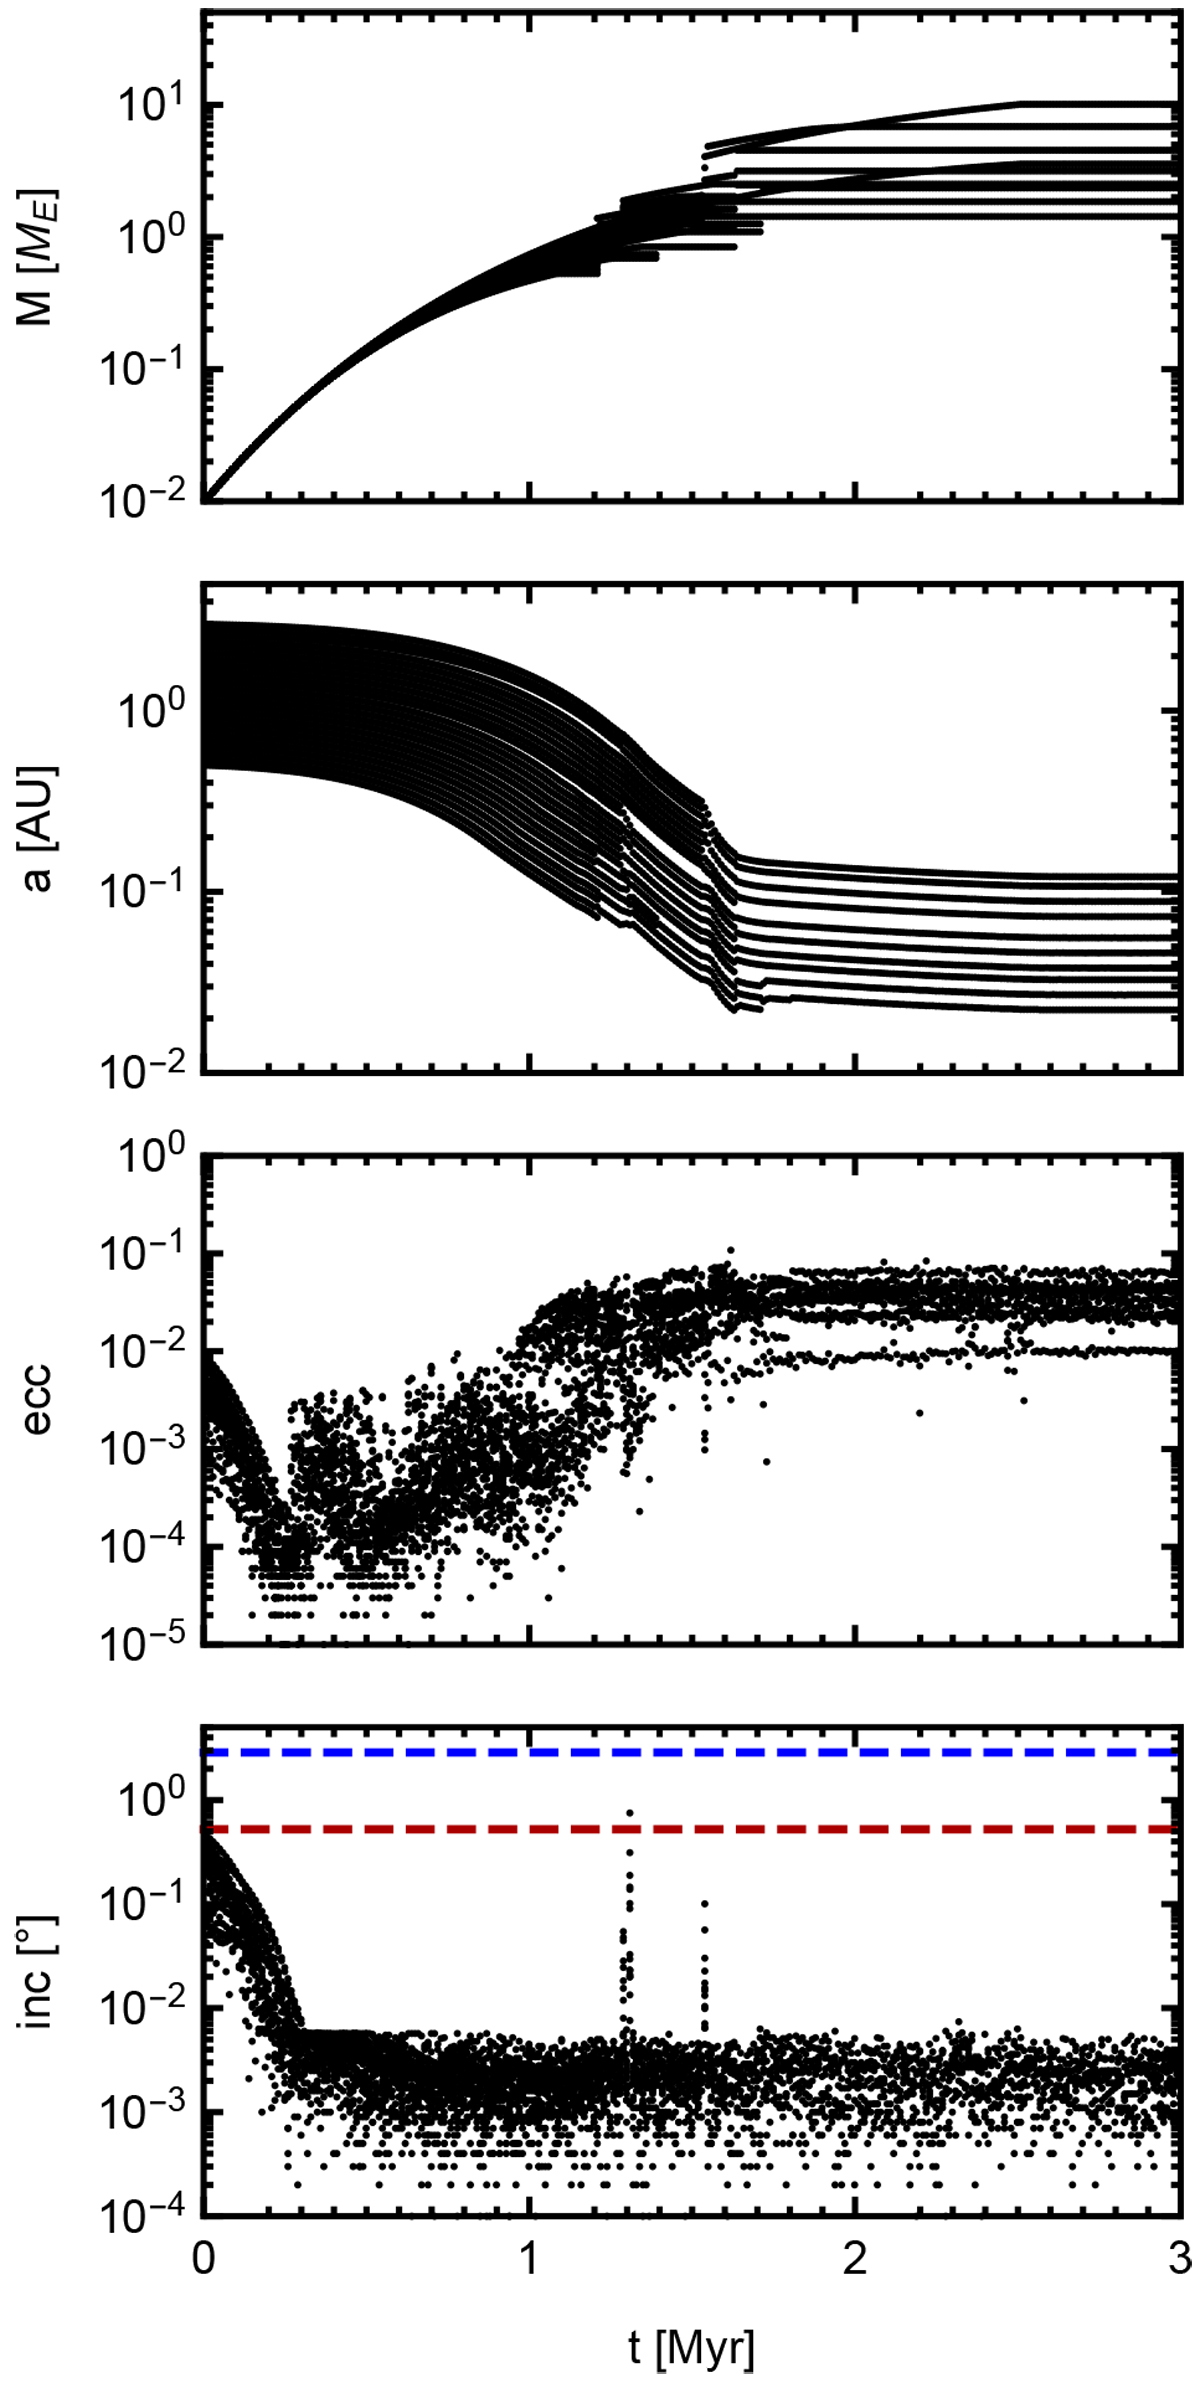
Example of the time evolution in the gas phase of the disc (runf5-1). Top panel: evolution of the mass of the embryos. Next panel down: decay of their orbits through type-1 migration, which only comes to a halt as embryos approach the inner edge. Bottom two panels: evolution of the eccentricity and inclination, respectively. In the last panel, the blue line corresponds to the opening angle of the gas scale height with respect to the midplane, and similarly the red curve shows the opening angle of the particle layer.
Current usage metrics show cumulative count of Article Views (full-text article views including HTML views, PDF and ePub downloads, according to the available data) and Abstracts Views on Vision4Press platform.
Data correspond to usage on the plateform after 2015. The current usage metrics is available 48-96 hours after online publication and is updated daily on week days.
Initial download of the metrics may take a while.