Fig. A.2
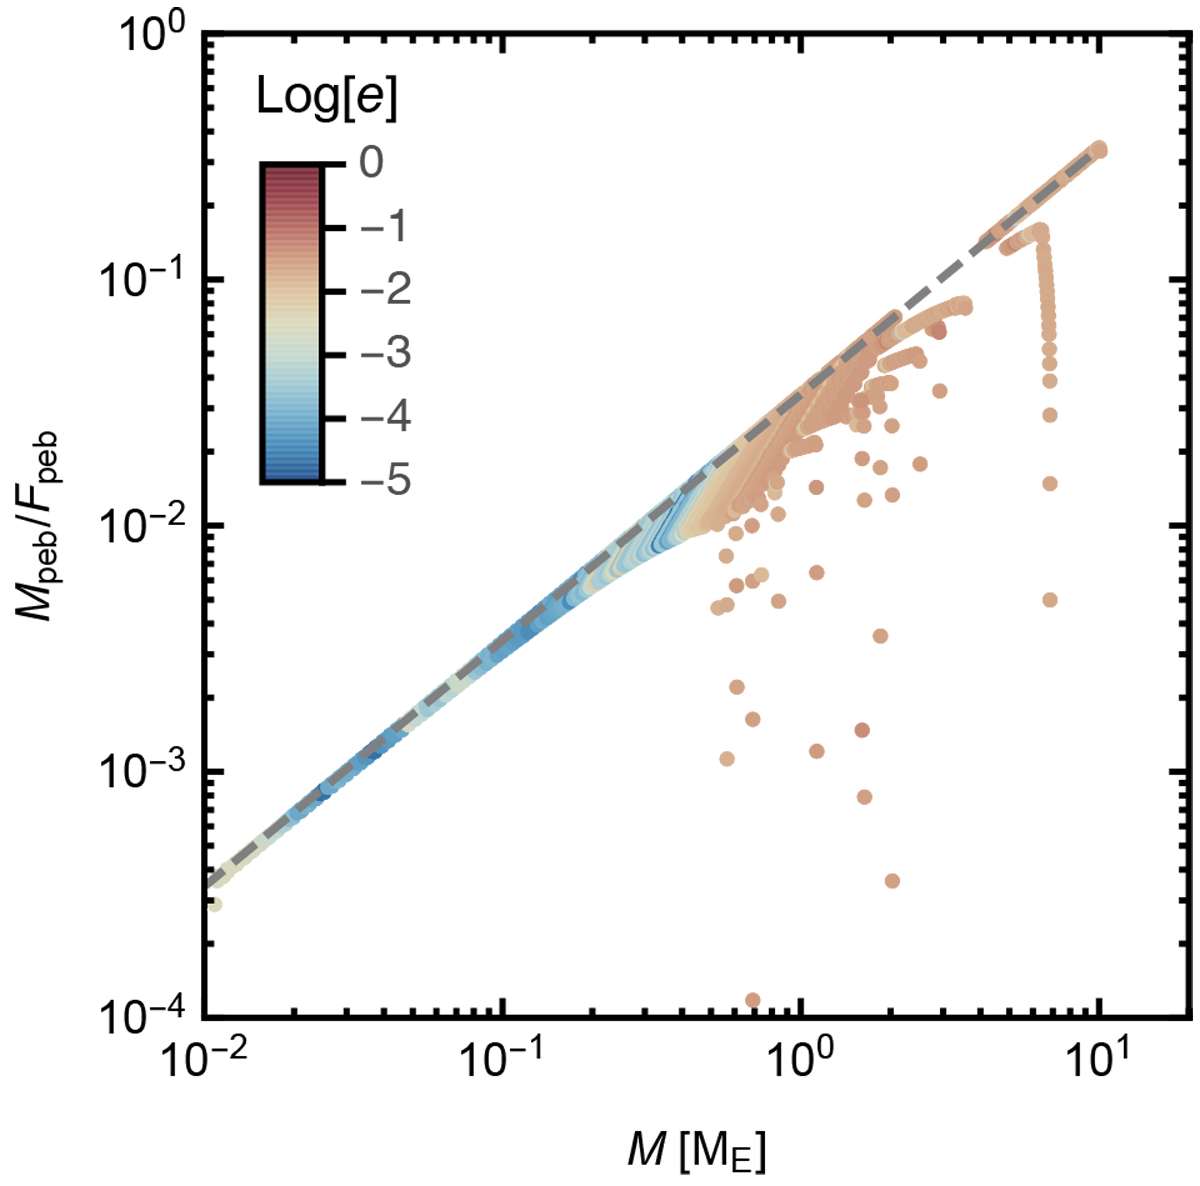
Accretion rate with respect to the total outer pebble flux, as function of embryo mass. The points show the embryos with their evolution shown in steps of 104 yr, for the 3 Myr duration of the gas disc phase (runf5-1). The colours correspond to the eccentricities of the bodies, as indicated by the colour bar. The grey dashed line is the analytical expression Eq. (10), which represents 3D accretion in the strong coupling limit. The strong reduction in accretion rate at late time is mainly due to pebble filtering by the outer embryos.
Current usage metrics show cumulative count of Article Views (full-text article views including HTML views, PDF and ePub downloads, according to the available data) and Abstracts Views on Vision4Press platform.
Data correspond to usage on the plateform after 2015. The current usage metrics is available 48-96 hours after online publication and is updated daily on week days.
Initial download of the metrics may take a while.