Fig. 6.
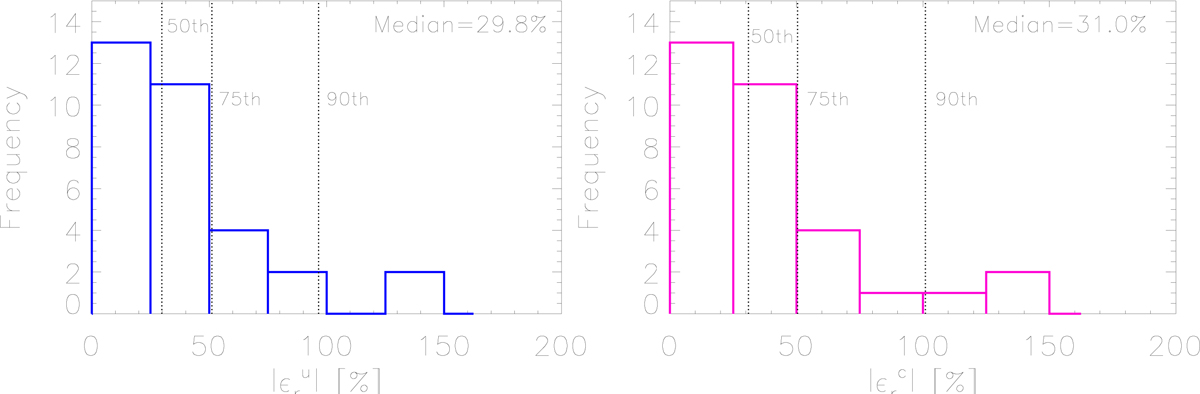
Histograms of the relative error in absolute value of the prediction of CME masses for the 32 events using Eq. (3). Left: absolute value of the relative errors of the CME mass estimation using the parameters from the fitting functions for the uncorrected case (Col. 16 of Table 1). Right: same for the corrected case (Col. 18 of Table 1). The vertical dotted lines indicate the 50th, 75th, and 90th percentiles.
Current usage metrics show cumulative count of Article Views (full-text article views including HTML views, PDF and ePub downloads, according to the available data) and Abstracts Views on Vision4Press platform.
Data correspond to usage on the plateform after 2015. The current usage metrics is available 48-96 hours after online publication and is updated daily on week days.
Initial download of the metrics may take a while.