Fig. 5.
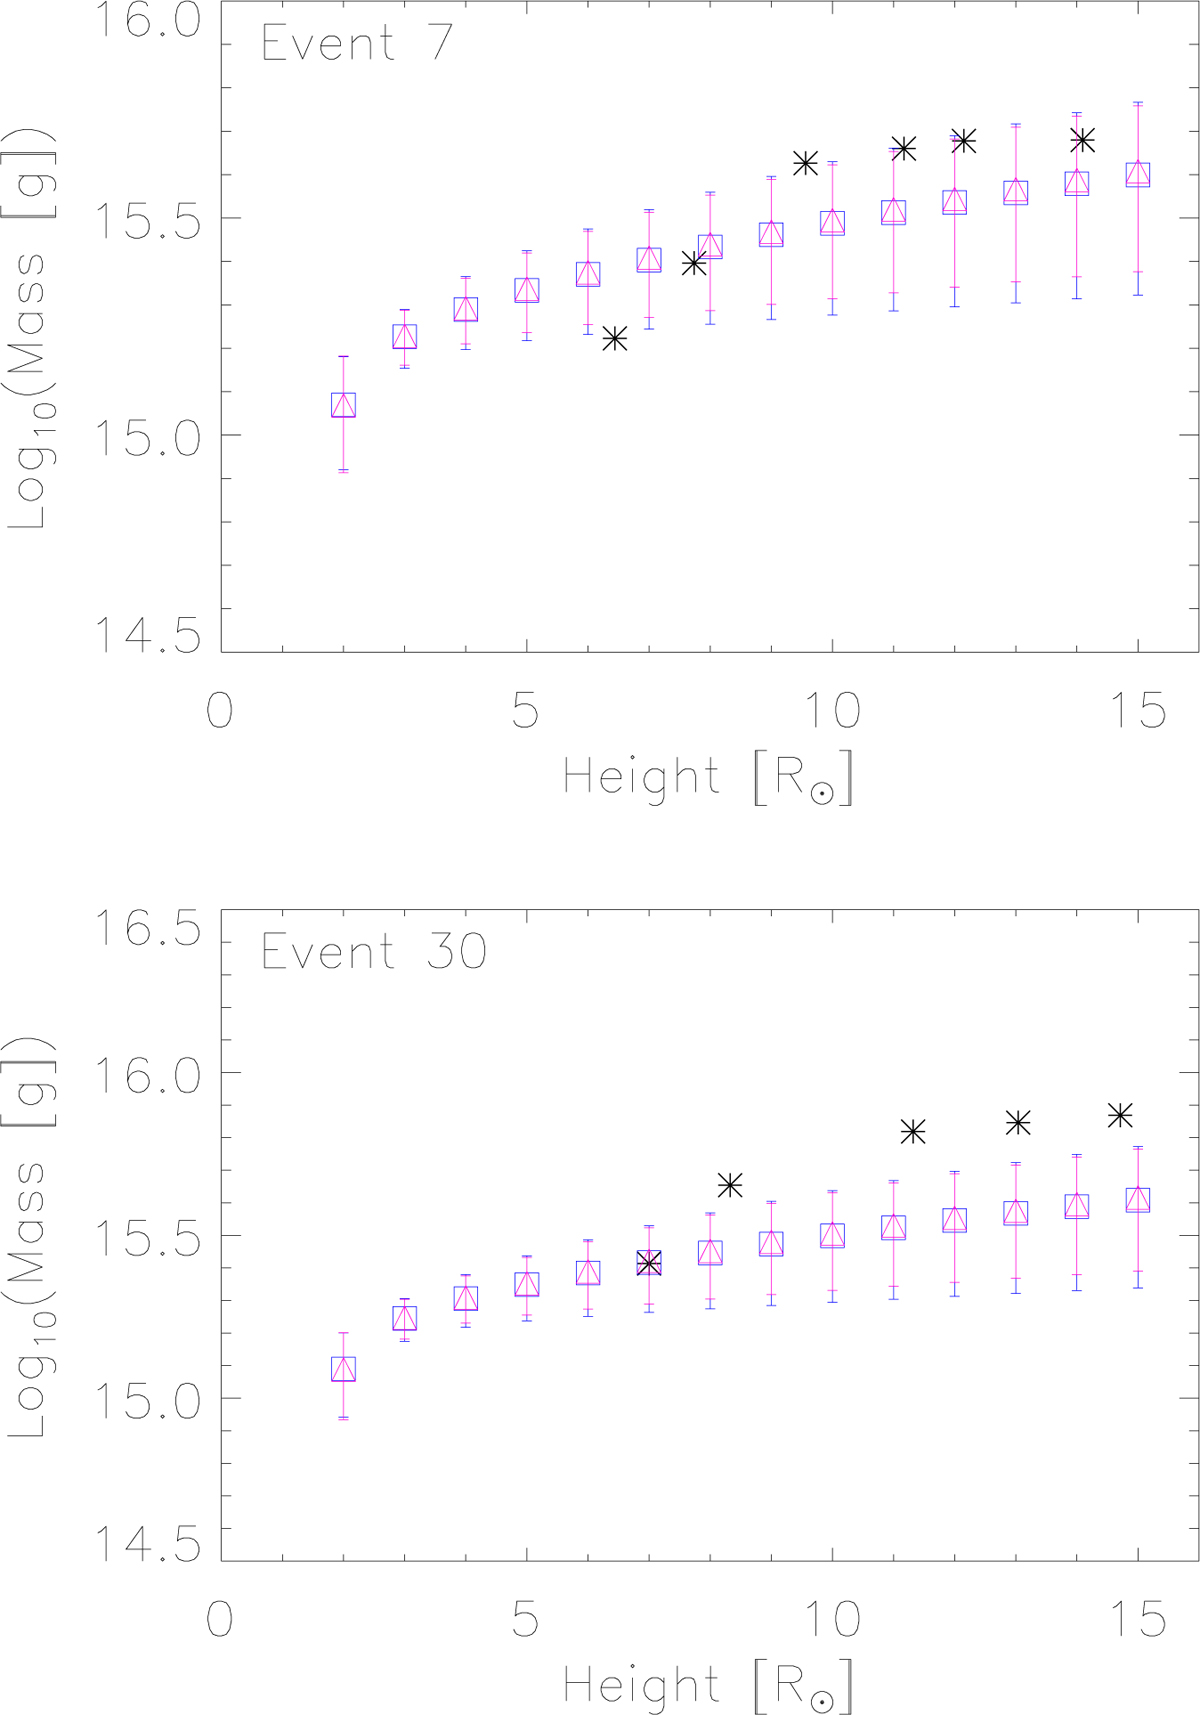
Evolution of the measured and predicted mass of the CMEs for events 7 and 30 as a function of height. The CME mass measured from COR2 white-light data is indicated by asterisks. The mass predicted by Eq. (3) is indicated by blue squares for the analysis based on uncorrected data and by magenta triangles for the analysis based on corrected data.
Current usage metrics show cumulative count of Article Views (full-text article views including HTML views, PDF and ePub downloads, according to the available data) and Abstracts Views on Vision4Press platform.
Data correspond to usage on the plateform after 2015. The current usage metrics is available 48-96 hours after online publication and is updated daily on week days.
Initial download of the metrics may take a while.