Fig. 4.
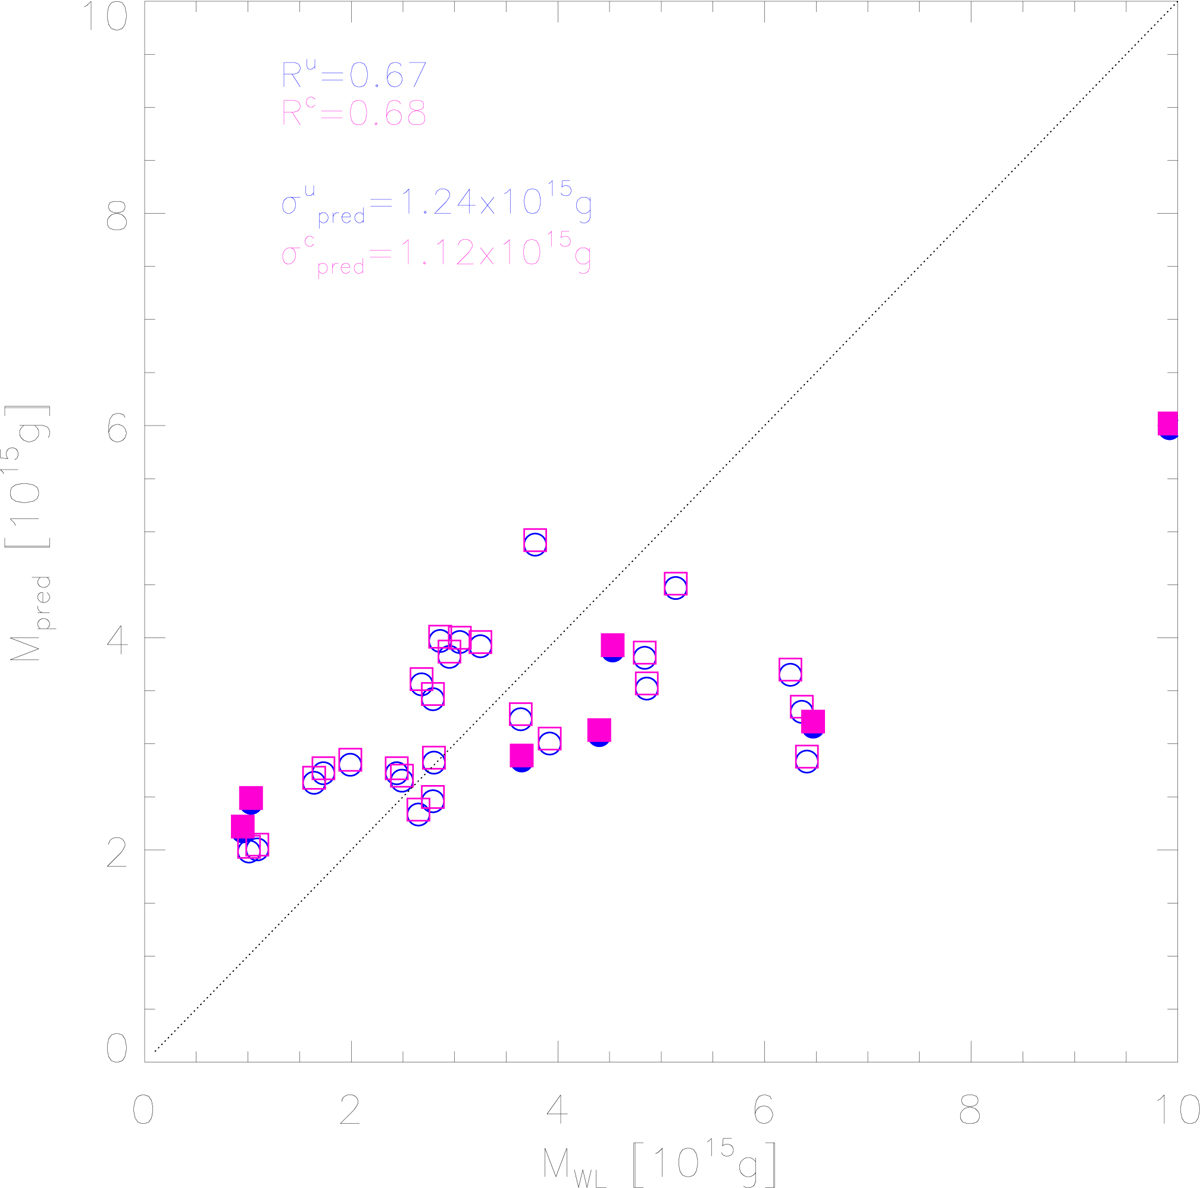
Mass of the CMEs predicted by the method (Mpred) vs. the CME mass determined from white-light data (MWL) for the 32 analyzed events at 10 R⊙. Blue circles represent masses predicted without applying the correction by the occulter effect, while magenta squares show the masses after the correction is applied. The filled symbols correspond to the events for which we could not apply the technique (see Sect. 4.1). The dotted straight line represents the identity line (Mpred = MWL). The correlation coefficients and the errors σpred of the predicted mass at 10 R⊙ are shown.
Current usage metrics show cumulative count of Article Views (full-text article views including HTML views, PDF and ePub downloads, according to the available data) and Abstracts Views on Vision4Press platform.
Data correspond to usage on the plateform after 2015. The current usage metrics is available 48-96 hours after online publication and is updated daily on week days.
Initial download of the metrics may take a while.