Fig. 1.
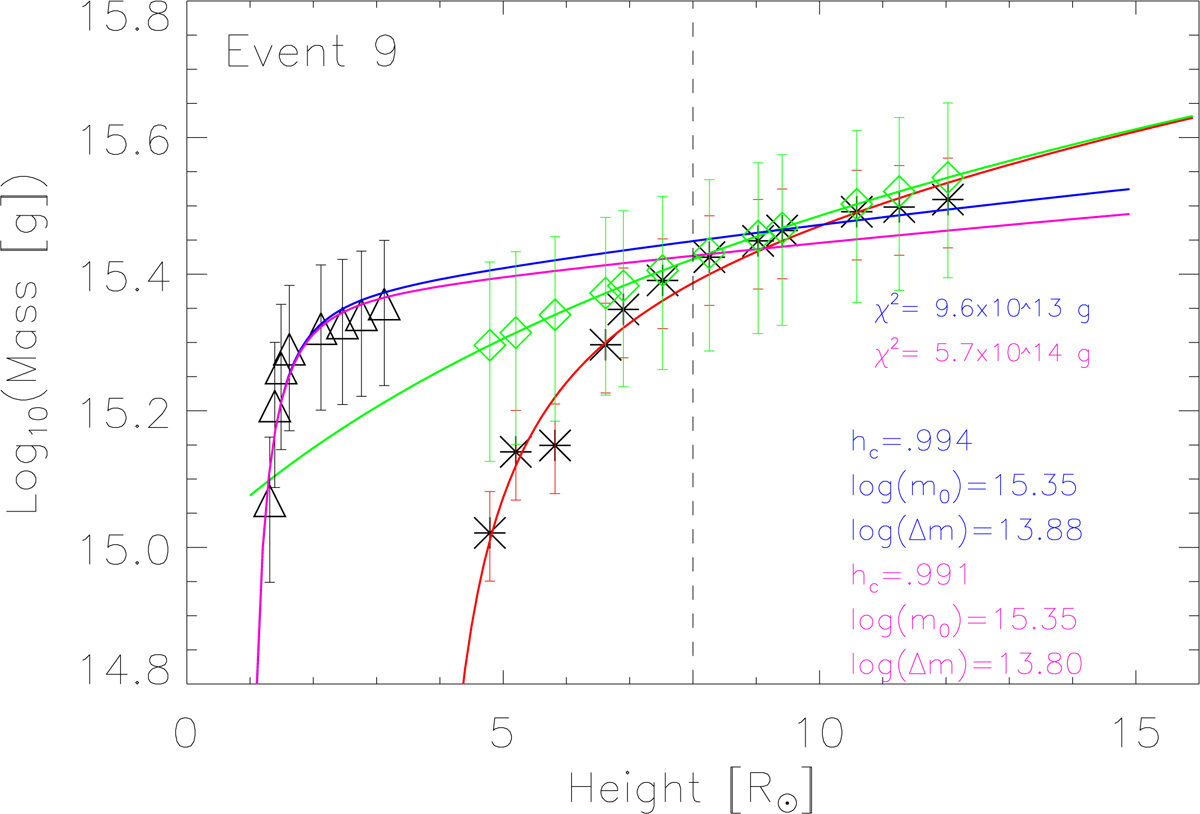
EUV mass loss (MEUV, triangles) and CME mass determined from COR2 white-light data (MCOR2, asterisks) values. The red curve shows the fit through all MCOR2 values. The blue curve is the fit through all MEUV values and MCOR2 values with h ≥ 8 R⊙. The diamonds indicate the MCOR2 values corrected by the occulter effect. The green curve is the fit yielded by Eq. (2) through these corrected values. The magenta curve is the fit through the corrected CME mass values and the MEUV mass-loss points. The vertical dashed line marks h = 8 R⊙.
Current usage metrics show cumulative count of Article Views (full-text article views including HTML views, PDF and ePub downloads, according to the available data) and Abstracts Views on Vision4Press platform.
Data correspond to usage on the plateform after 2015. The current usage metrics is available 48-96 hours after online publication and is updated daily on week days.
Initial download of the metrics may take a while.