Fig. B.9.
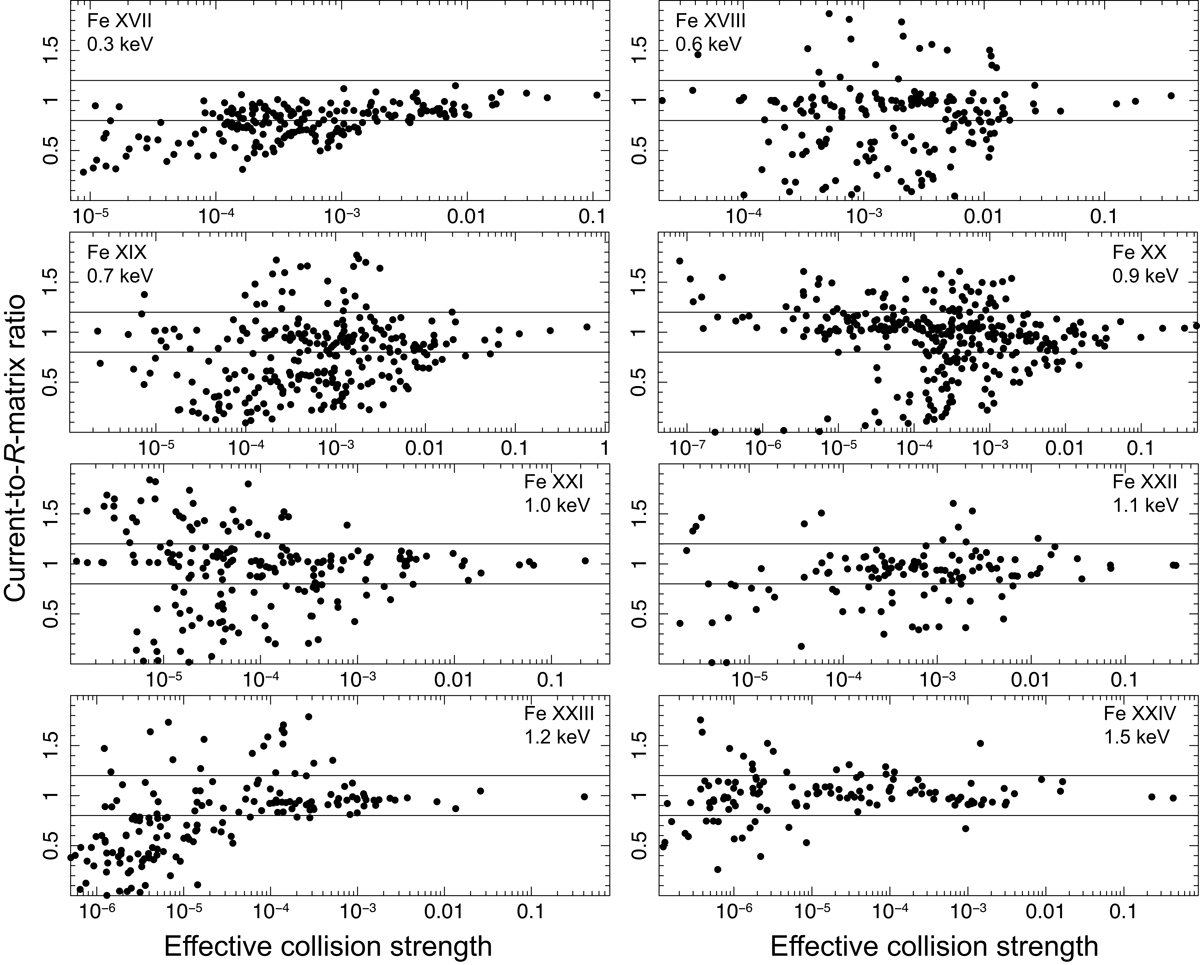
Ratios of the effective collision strengths from the current calculations to those from the recent R-matrix calculations, for all excitations from the ground states of the Fe-L species. The comparison is made at the temperature with peak ionization concentration of each ion (see Fig. 7). The horizontal lines indicate 20% differences.
Current usage metrics show cumulative count of Article Views (full-text article views including HTML views, PDF and ePub downloads, according to the available data) and Abstracts Views on Vision4Press platform.
Data correspond to usage on the plateform after 2015. The current usage metrics is available 48-96 hours after online publication and is updated daily on week days.
Initial download of the metrics may take a while.