Free Access
Fig. 12.
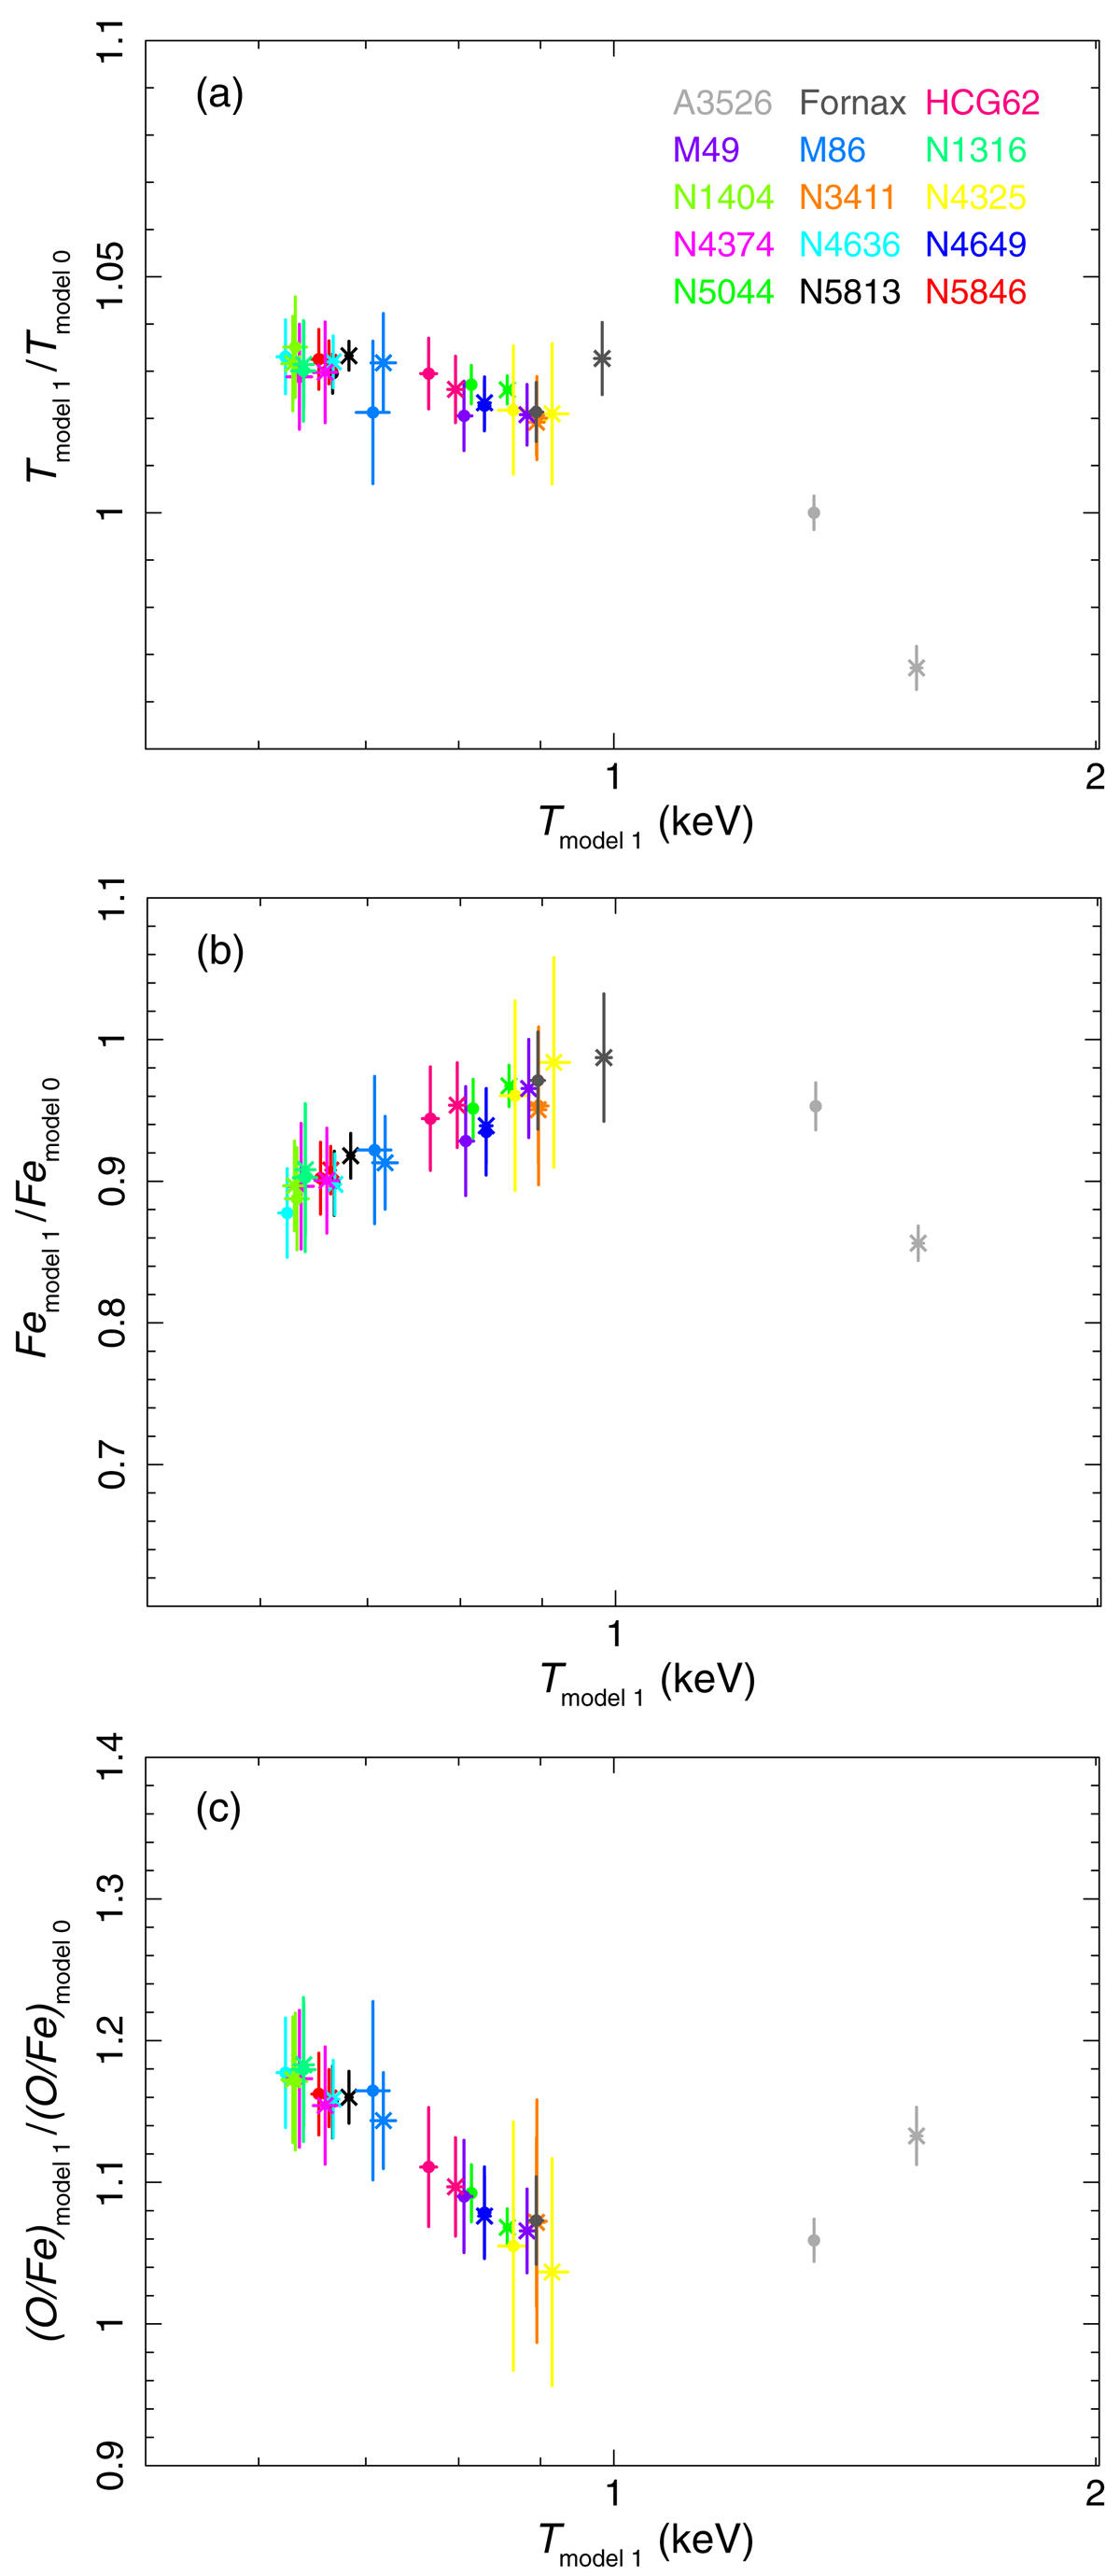
Ratios of the best-fit (panel a) temperatures, (panel b) Fe abundances, and (panel c) O/Fe with model 1 and model 0. All values are obtained in the single-temperature fits. Data with crosses and dots are ratios determined in the 3.4 arcmin and 0.8 arcmin regions, respectively.
Current usage metrics show cumulative count of Article Views (full-text article views including HTML views, PDF and ePub downloads, according to the available data) and Abstracts Views on Vision4Press platform.
Data correspond to usage on the plateform after 2015. The current usage metrics is available 48-96 hours after online publication and is updated daily on week days.
Initial download of the metrics may take a while.