Fig. 10.
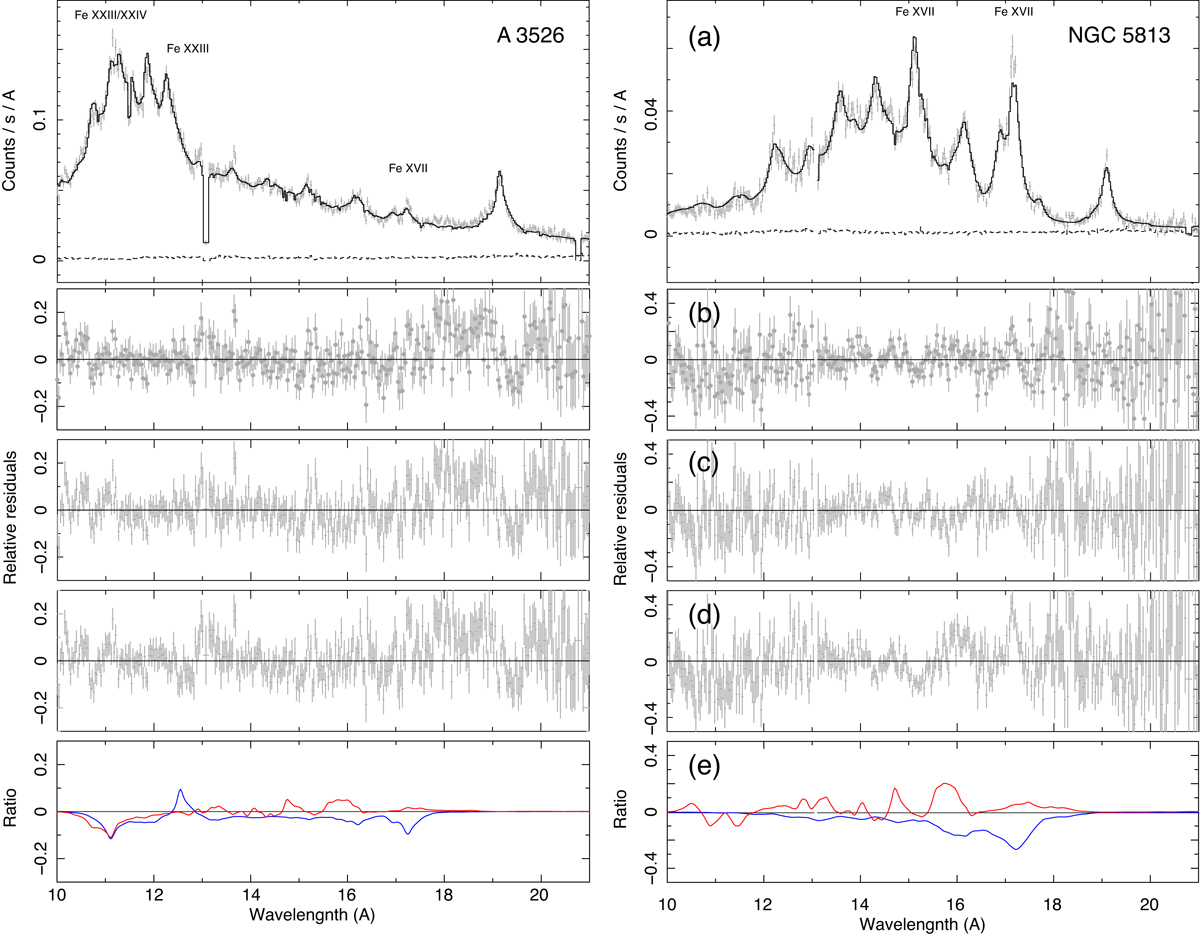
Reflection Grating Spectrometer (RGS) spectra of the central 3.4 arcmin regions of Abell 3526 (left) and NGC 5813 (right) in the 10 − 21 Å band fitted with different models. Panel a: fits by the two-temperature cie with model 1, the residuals are shown in panel b. Panels c and d: residuals of the fits with models 2 and 0, respectively. Panel e: ratios among the three model spectra. The model 0 to model 1 ratios are plotted in blue, and the model 2 to model 1 ratios are plotted in red. It can be seen that the line emissivities of model 1 are higher than those of model 0, but slightly lower than those of model 2, in the 15 − 17 Å band.
Current usage metrics show cumulative count of Article Views (full-text article views including HTML views, PDF and ePub downloads, according to the available data) and Abstracts Views on Vision4Press platform.
Data correspond to usage on the plateform after 2015. The current usage metrics is available 48-96 hours after online publication and is updated daily on week days.
Initial download of the metrics may take a while.