Fig. 9.
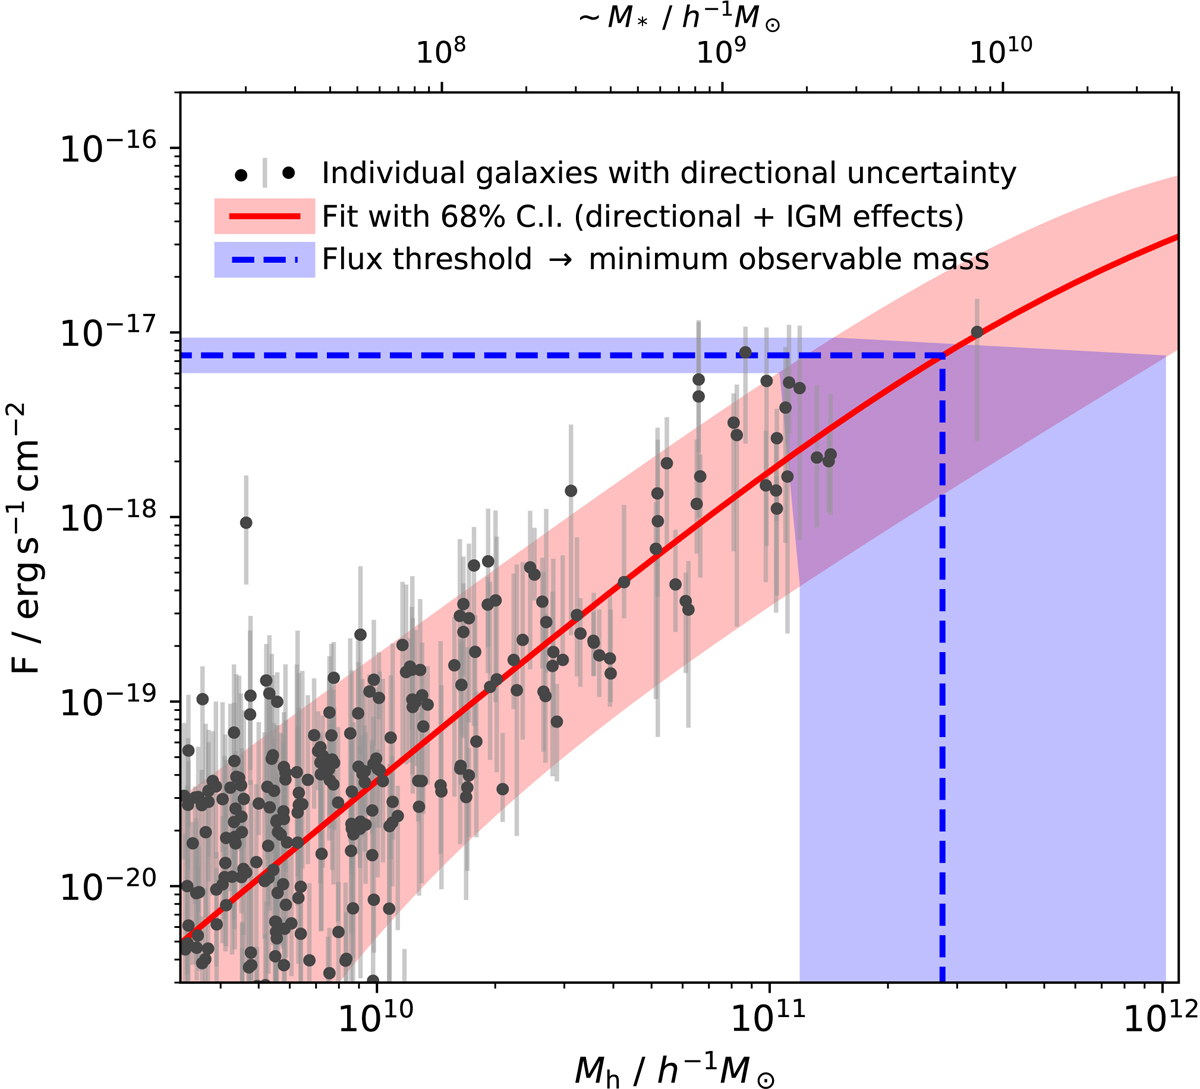
Flux F measured inside a 1![]() 4 circular aperture (black dots) with errors given by the 68% scatter in the six directions of observation, as a function of halo mass Mh. Additional to this “intrinsic” variation, the inhomogeneous IGM, as well as the fact that galaxies of similar masses exhibit a variety in physical properties, introduces a scatter in possible values of observed flux; the 68% PI of this scatter is represented by the red, shaded region, while the solid, red line is the double power law given in Eq. (18). The dashed, blue line shows how the flux threshold of the detectors results in a minimum, observable halo mass Mh, min, and the shaded, blue region shows how the spread in detector thresholds, combined with the spread in fluxes, results in a spread in Mh, min.
4 circular aperture (black dots) with errors given by the 68% scatter in the six directions of observation, as a function of halo mass Mh. Additional to this “intrinsic” variation, the inhomogeneous IGM, as well as the fact that galaxies of similar masses exhibit a variety in physical properties, introduces a scatter in possible values of observed flux; the 68% PI of this scatter is represented by the red, shaded region, while the solid, red line is the double power law given in Eq. (18). The dashed, blue line shows how the flux threshold of the detectors results in a minimum, observable halo mass Mh, min, and the shaded, blue region shows how the spread in detector thresholds, combined with the spread in fluxes, results in a spread in Mh, min.
Current usage metrics show cumulative count of Article Views (full-text article views including HTML views, PDF and ePub downloads, according to the available data) and Abstracts Views on Vision4Press platform.
Data correspond to usage on the plateform after 2015. The current usage metrics is available 48-96 hours after online publication and is updated daily on week days.
Initial download of the metrics may take a while.