Fig. 6.
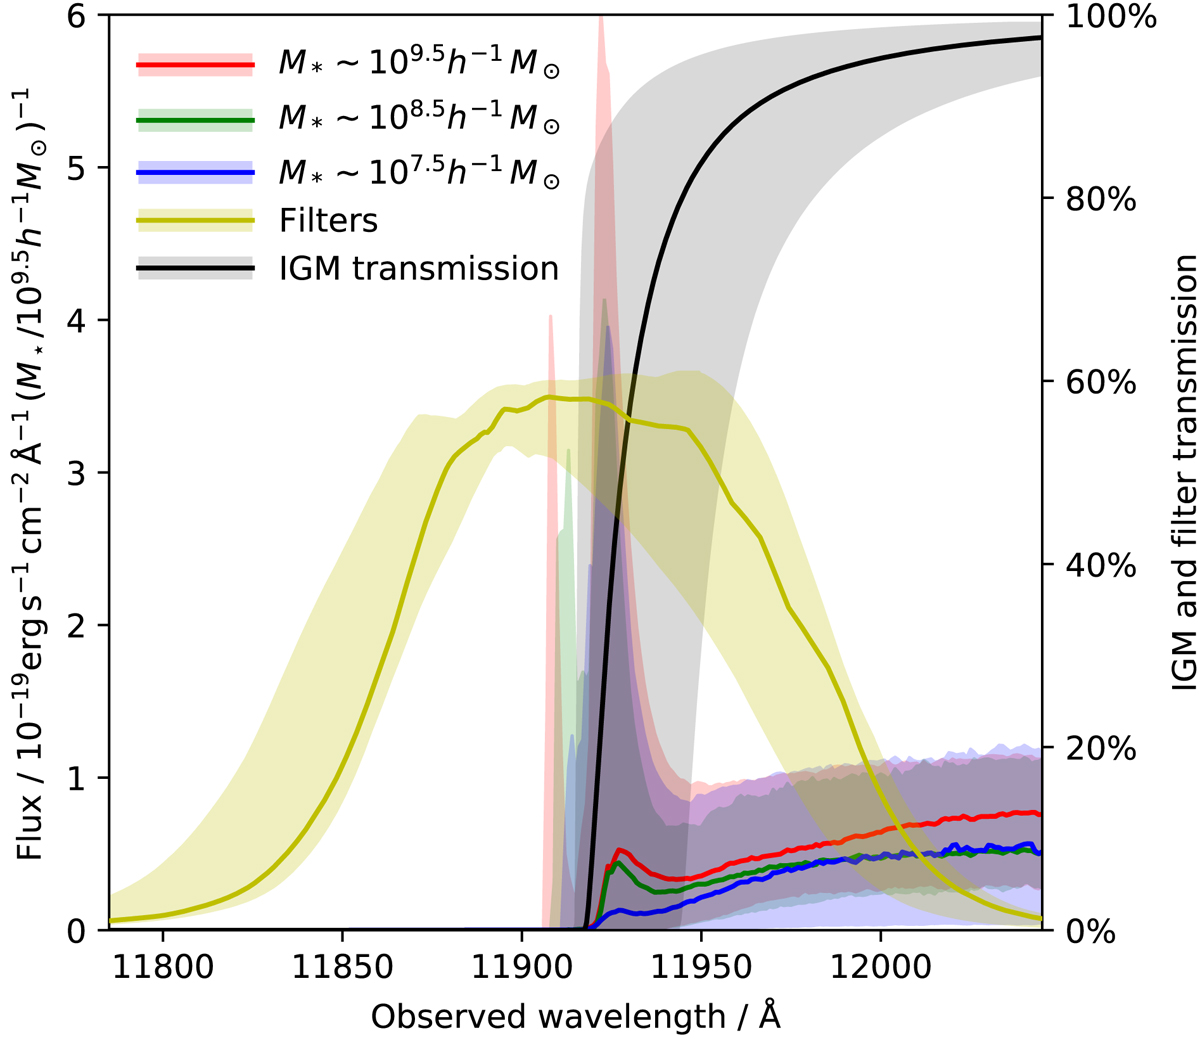
Median spectra of galaxies in various halo mass ranges, normalized to the same stellar mass (109.5 h−1 M⊙), and including the impact of the IGM on the line. The shaded areas show the 68% PIs. Although the median flux in the line hardly rises above the continuum, prominent lines are seen for a significant fraction of the galaxies. Also shown (using the right y axis) is the median transmission of the 16 filters (yellow), and the IGM transmission 𝒯(λ) (black), with the shaded regions showing the 68% scatter.
Current usage metrics show cumulative count of Article Views (full-text article views including HTML views, PDF and ePub downloads, according to the available data) and Abstracts Views on Vision4Press platform.
Data correspond to usage on the plateform after 2015. The current usage metrics is available 48-96 hours after online publication and is updated daily on week days.
Initial download of the metrics may take a while.