Fig. 5.
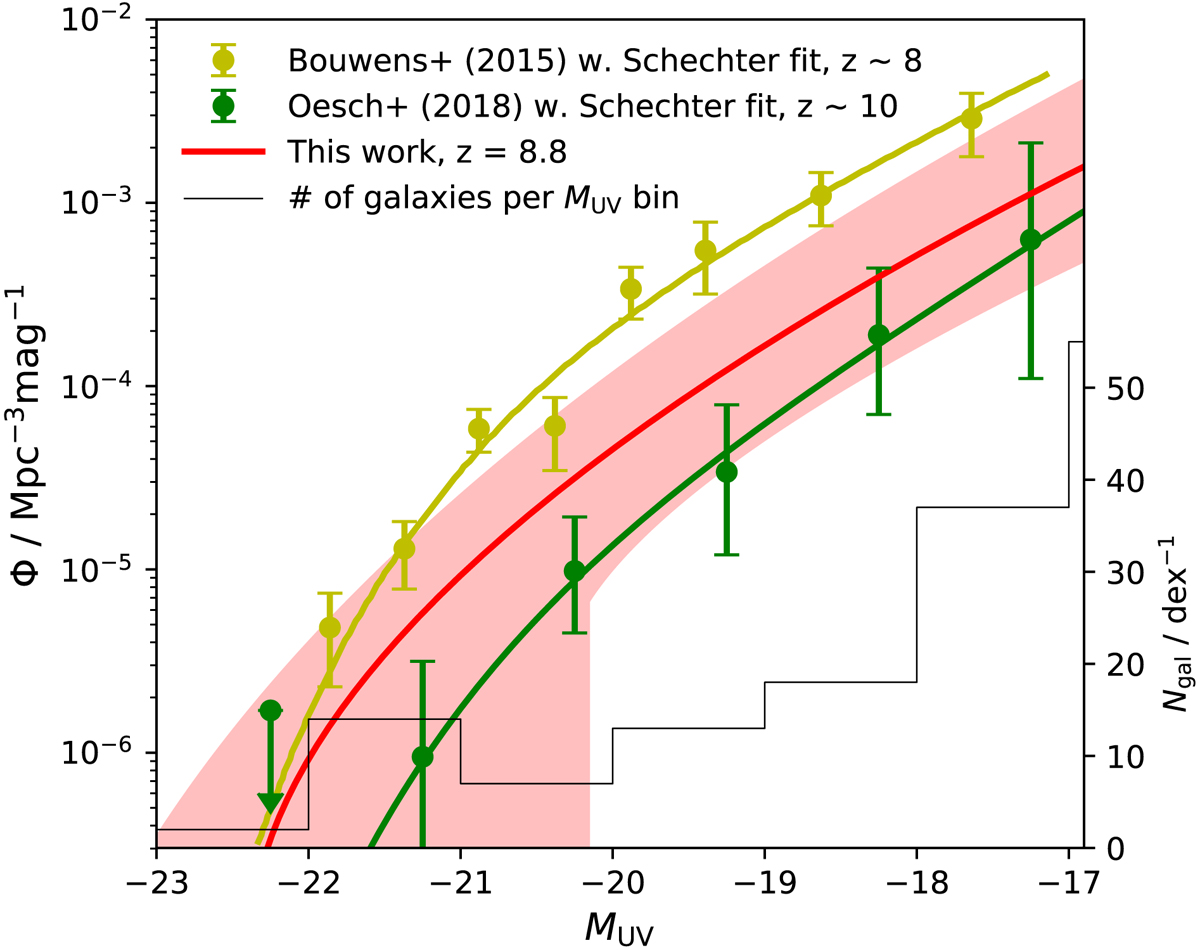
Luminosity function Φ at 1600 Å of the simulated galaxies (red solid). The red shaded region shows the 68% spread in Φ, which at the faint end reflects a scatter in the intrinsic UV luminosity, and at the bright also the anisotropic escape of UV radiation due to dust, as well as small-number statistics. Yellow and green dots with error bars show the observed LFs at z ∼ 8 (Bouwens et al. 2015) and z ∼ 10 (Oesch et al. 2018), respectively, with the associated solid lines showing the best-fitting Schechter (1976)-functions. The number of simulated galaxies used for our fit is shown in solid black, with the corresponding numbers on the right y axis.
Current usage metrics show cumulative count of Article Views (full-text article views including HTML views, PDF and ePub downloads, according to the available data) and Abstracts Views on Vision4Press platform.
Data correspond to usage on the plateform after 2015. The current usage metrics is available 48-96 hours after online publication and is updated daily on week days.
Initial download of the metrics may take a while.