Fig. 3.
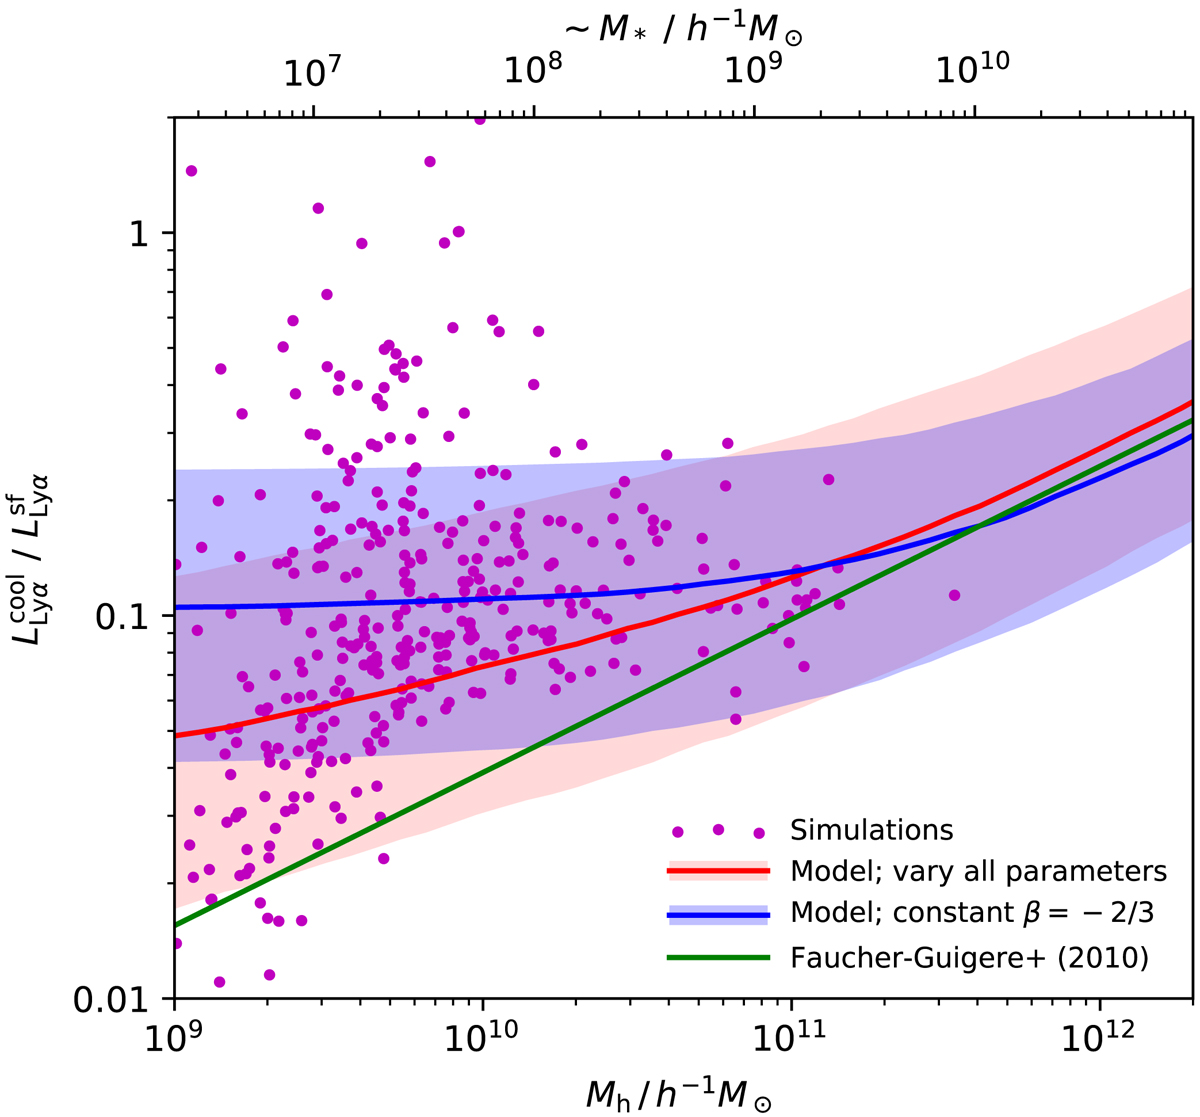
Ratio ![]() for our simulated galaxies (magenta), juxtaposed with two versions of the theoretical model presented in Sect. 3.3.2: Red shows the ratio if all parameters entering the expression for cooling radiation (Eq. (12)) are varied in the ranges substantiated in Sect. 3.3.2, while blue shows the relation when fixing the slope describing the mass loading to β = −2/3, the value appropriate for energy-driven winds, which we have used in our simulated. In both cases, the shaded regions show the 68% confidence intervals, given by the uncertainties of the parameters entering Eq. (12). The ratio as predicted by Faucher-Giguere et al. (2010) is shown in green – this model does not explicitly include gas ejection which is easier for small galaxies in our model, and hence results in a higher ratio at low masses.
for our simulated galaxies (magenta), juxtaposed with two versions of the theoretical model presented in Sect. 3.3.2: Red shows the ratio if all parameters entering the expression for cooling radiation (Eq. (12)) are varied in the ranges substantiated in Sect. 3.3.2, while blue shows the relation when fixing the slope describing the mass loading to β = −2/3, the value appropriate for energy-driven winds, which we have used in our simulated. In both cases, the shaded regions show the 68% confidence intervals, given by the uncertainties of the parameters entering Eq. (12). The ratio as predicted by Faucher-Giguere et al. (2010) is shown in green – this model does not explicitly include gas ejection which is easier for small galaxies in our model, and hence results in a higher ratio at low masses.
Current usage metrics show cumulative count of Article Views (full-text article views including HTML views, PDF and ePub downloads, according to the available data) and Abstracts Views on Vision4Press platform.
Data correspond to usage on the plateform after 2015. The current usage metrics is available 48-96 hours after online publication and is updated daily on week days.
Initial download of the metrics may take a while.