Fig. 2.
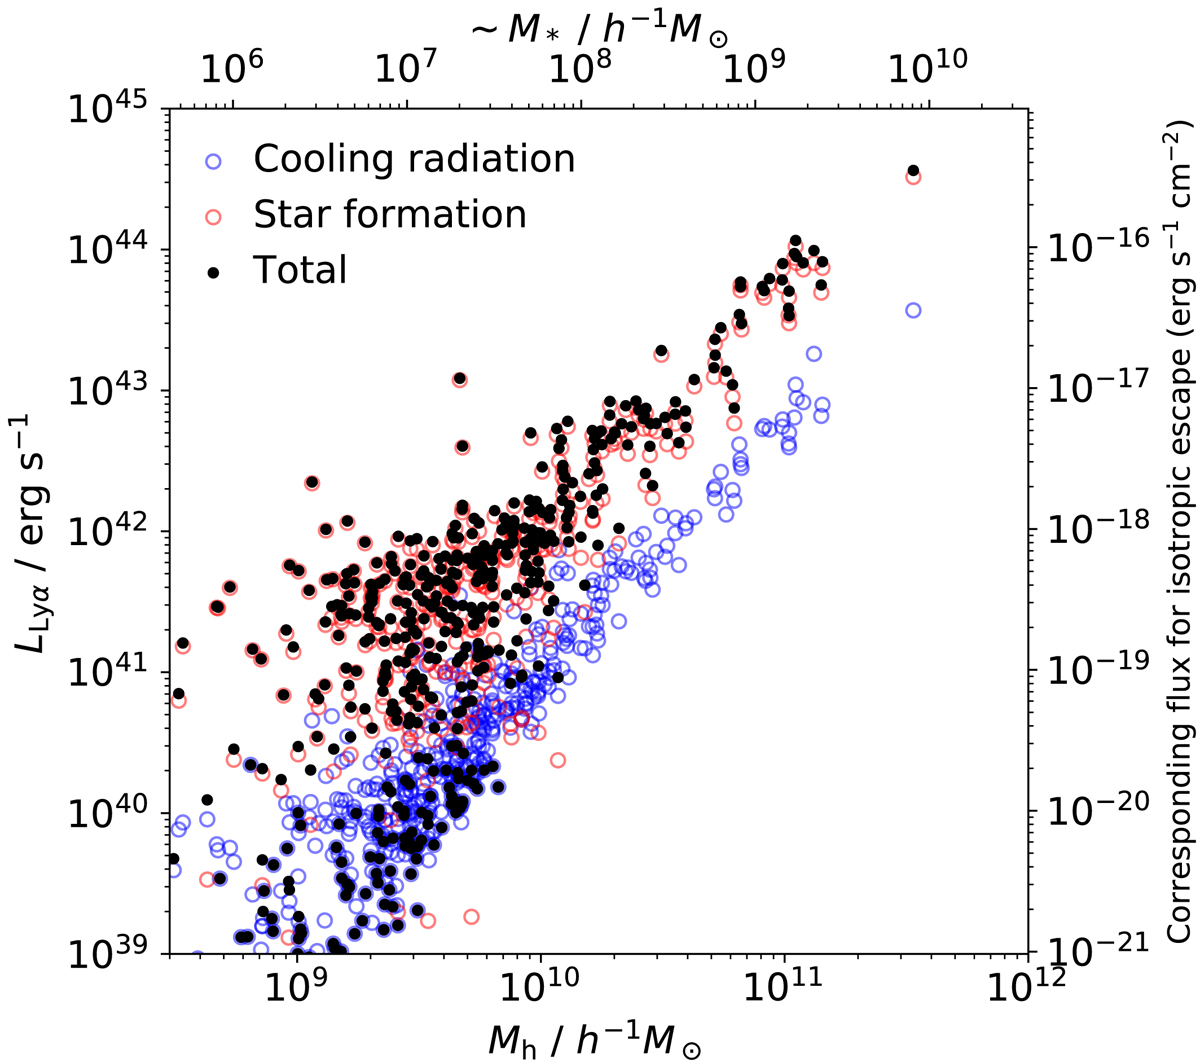
Total, “intrinsically” emitted Lyα ![]() (black dots), and the contributions from star formation (
(black dots), and the contributions from star formation (![]() ; red circles) and cooling radiation (
; red circles) and cooling radiation (![]() ; blue circles). The secondary y axis on the right shows the corresponding flux that would be measured at Earth, in the unrealistic case that Lyα photons escape isotropically, and were not absorbed by dust or scattered out of the LOS by neutral hydrogen. As seen in Fig. 9, the actual measured values are quite a lot smaller.
; blue circles). The secondary y axis on the right shows the corresponding flux that would be measured at Earth, in the unrealistic case that Lyα photons escape isotropically, and were not absorbed by dust or scattered out of the LOS by neutral hydrogen. As seen in Fig. 9, the actual measured values are quite a lot smaller.
Current usage metrics show cumulative count of Article Views (full-text article views including HTML views, PDF and ePub downloads, according to the available data) and Abstracts Views on Vision4Press platform.
Data correspond to usage on the plateform after 2015. The current usage metrics is available 48-96 hours after online publication and is updated daily on week days.
Initial download of the metrics may take a while.