Fig. B.3.
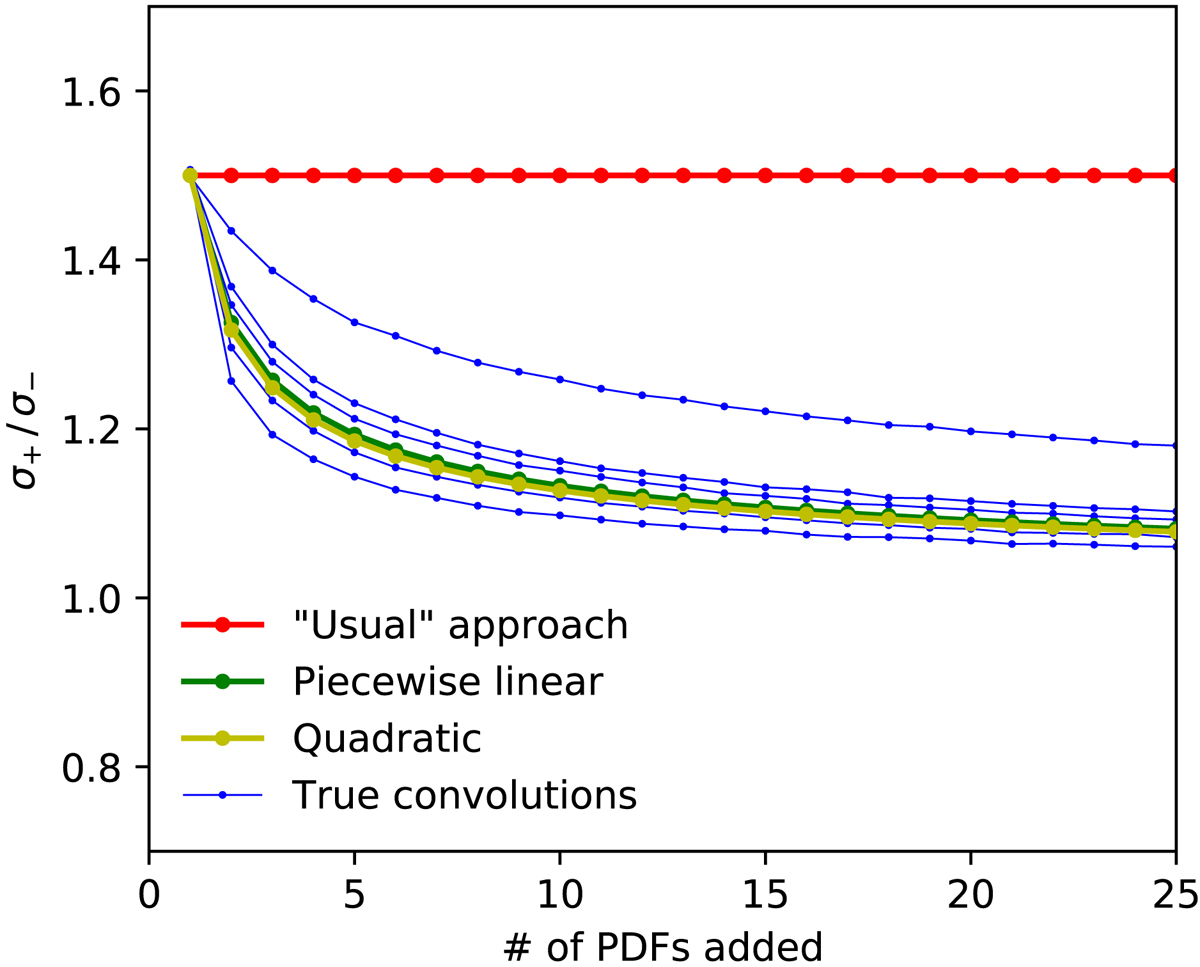
Decline of the ratio between upper (σ+) and lower (σ−) error when adding multiple PDFs of the same asymmetry, as a function of number of PDFs added. Blue curves show five examples of functional forms that all have ![]() ; from the bottom and up are: skewed Gaussian, Weibull, lognormal, Fréchet, and loglogistic (with the latter declining somewhat slower than the others). Whereas the “usual” method of adding errors in quadrature never departs from σ+/σ− = 1.5 (red), the linear (green) and quadratic (yellow) error propagation detailed in this section both perform well in terms of describing the evolution of the asymmetry.
; from the bottom and up are: skewed Gaussian, Weibull, lognormal, Fréchet, and loglogistic (with the latter declining somewhat slower than the others). Whereas the “usual” method of adding errors in quadrature never departs from σ+/σ− = 1.5 (red), the linear (green) and quadratic (yellow) error propagation detailed in this section both perform well in terms of describing the evolution of the asymmetry.
Current usage metrics show cumulative count of Article Views (full-text article views including HTML views, PDF and ePub downloads, according to the available data) and Abstracts Views on Vision4Press platform.
Data correspond to usage on the plateform after 2015. The current usage metrics is available 48-96 hours after online publication and is updated daily on week days.
Initial download of the metrics may take a while.