Fig. 13.
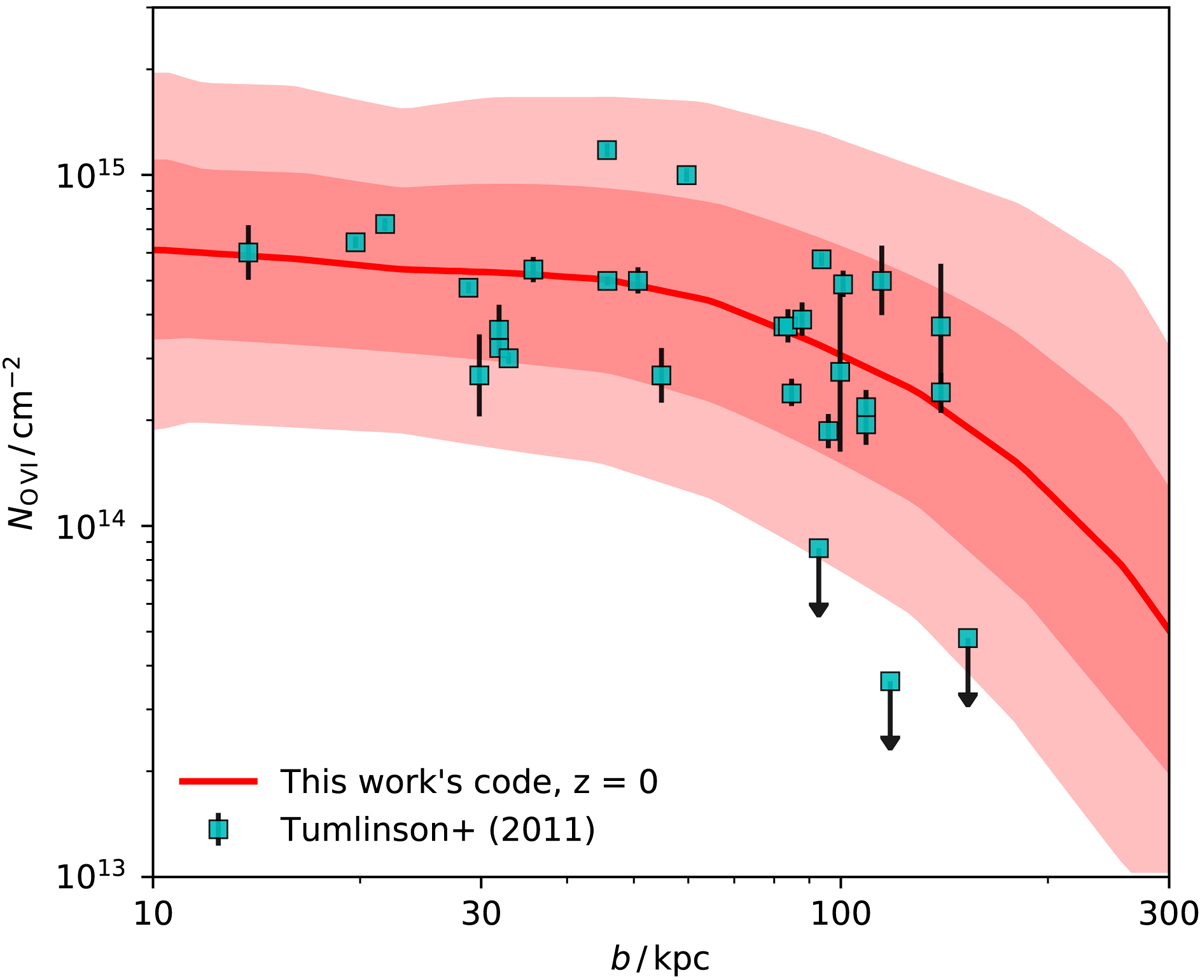
Median O VI column density NO VI (red) as a function of impact parameter b, averaged over 6800 sightlines through eight z = 0 disc galaxies simulated using the same code as the one utilized in this work. Shaded regions indicate the 1σ and 2σ deviations from the median, respectively. The observations of “star-forming” galaxies by Tumlinson et al. (2011) are shown by cyan squares.
Current usage metrics show cumulative count of Article Views (full-text article views including HTML views, PDF and ePub downloads, according to the available data) and Abstracts Views on Vision4Press platform.
Data correspond to usage on the plateform after 2015. The current usage metrics is available 48-96 hours after online publication and is updated daily on week days.
Initial download of the metrics may take a while.