Fig. 12.
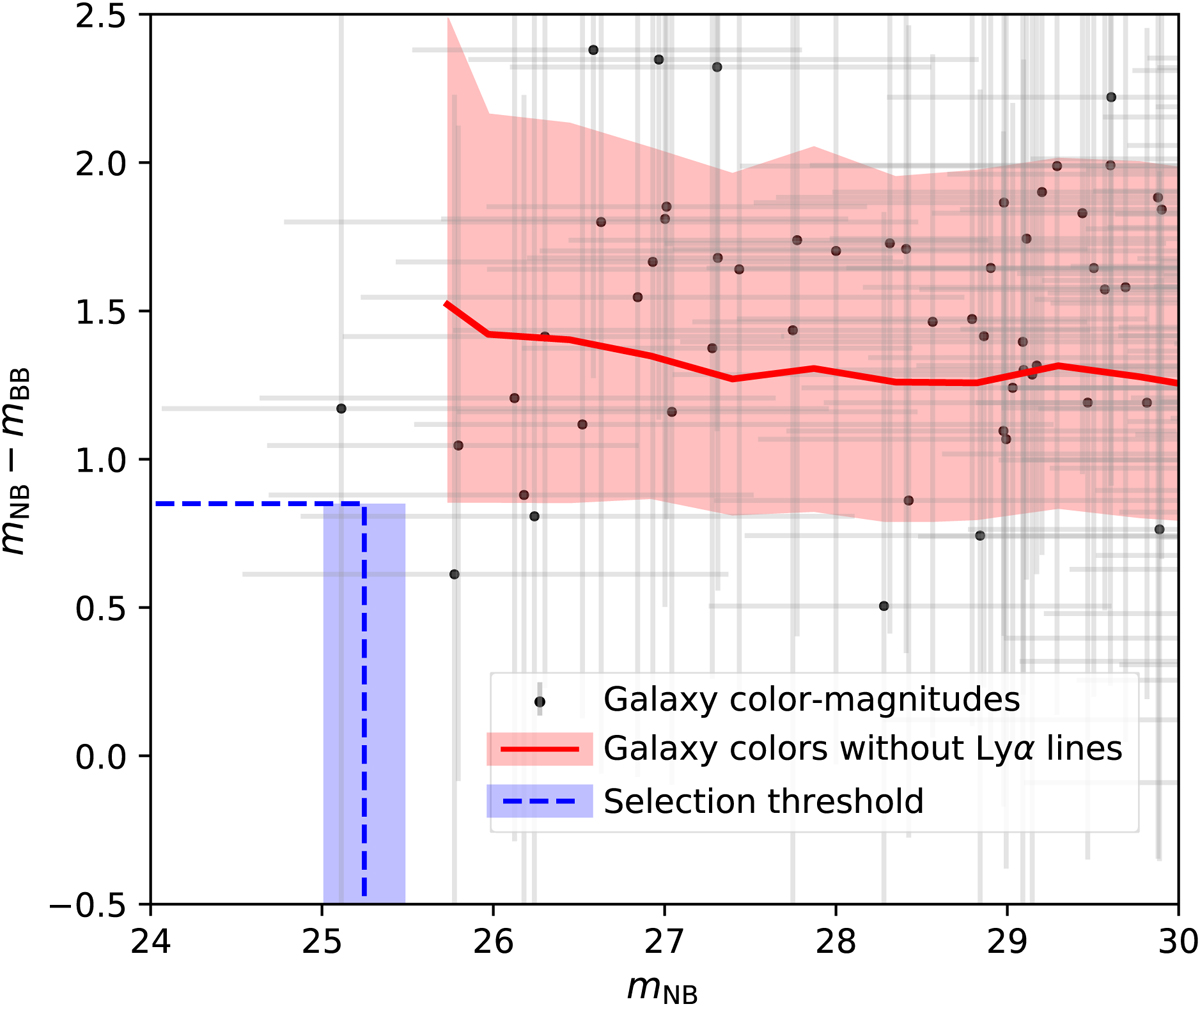
Colour-magnitude diagram of the simulated galaxies. Black dots show individual galaxies, with grey error bars showing the 68% scatter for different sightlines. The red line shows a running median (with shaded 68% PI) of the mNB − mBB colour as a function of NB magnitude for all galaxies when we artificially remove their Lyα emission lines. The selection criteria are shown with blue dashed lines; the magnitude threshold is the same as in Sect. 4.6, while the colour threshold is set to mNB − mBB < +0.85, corresponding roughly to the lower limit of the “no Lyα”. Although no galaxy on average falls inside the selection square, the directional variance results in a probability of a few tens of % of being selected, albeit for the brightest galaxies only.
Current usage metrics show cumulative count of Article Views (full-text article views including HTML views, PDF and ePub downloads, according to the available data) and Abstracts Views on Vision4Press platform.
Data correspond to usage on the plateform after 2015. The current usage metrics is available 48-96 hours after online publication and is updated daily on week days.
Initial download of the metrics may take a while.