Fig. 11.
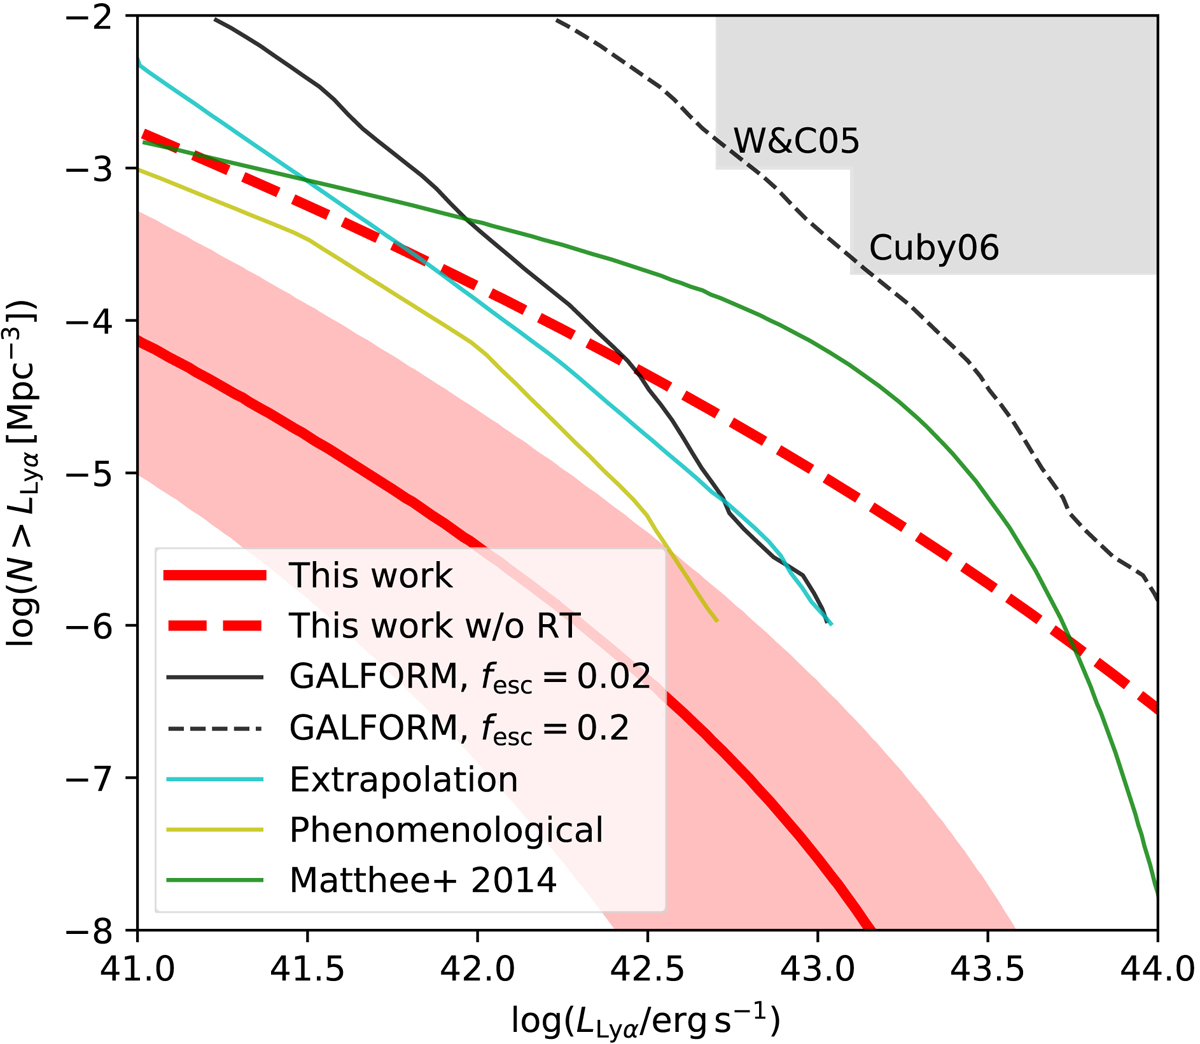
Lyα LF predicted from our simulations (red with shaded area showing the 68% PI), compared to the three models of Nilsson et al. (2007, described in Sect. 1). Also shown, with the red dashed line, is the Lyα LF predicted from our simulations if we did not take into account RT effects. Additionally, the upper limit LF of Matthee et al. (2014) is shown in green. The grey region marks observational upper limits from Willis & Courbin (2005) and Cuby et al. (2007).
Current usage metrics show cumulative count of Article Views (full-text article views including HTML views, PDF and ePub downloads, according to the available data) and Abstracts Views on Vision4Press platform.
Data correspond to usage on the plateform after 2015. The current usage metrics is available 48-96 hours after online publication and is updated daily on week days.
Initial download of the metrics may take a while.