Fig. 6.
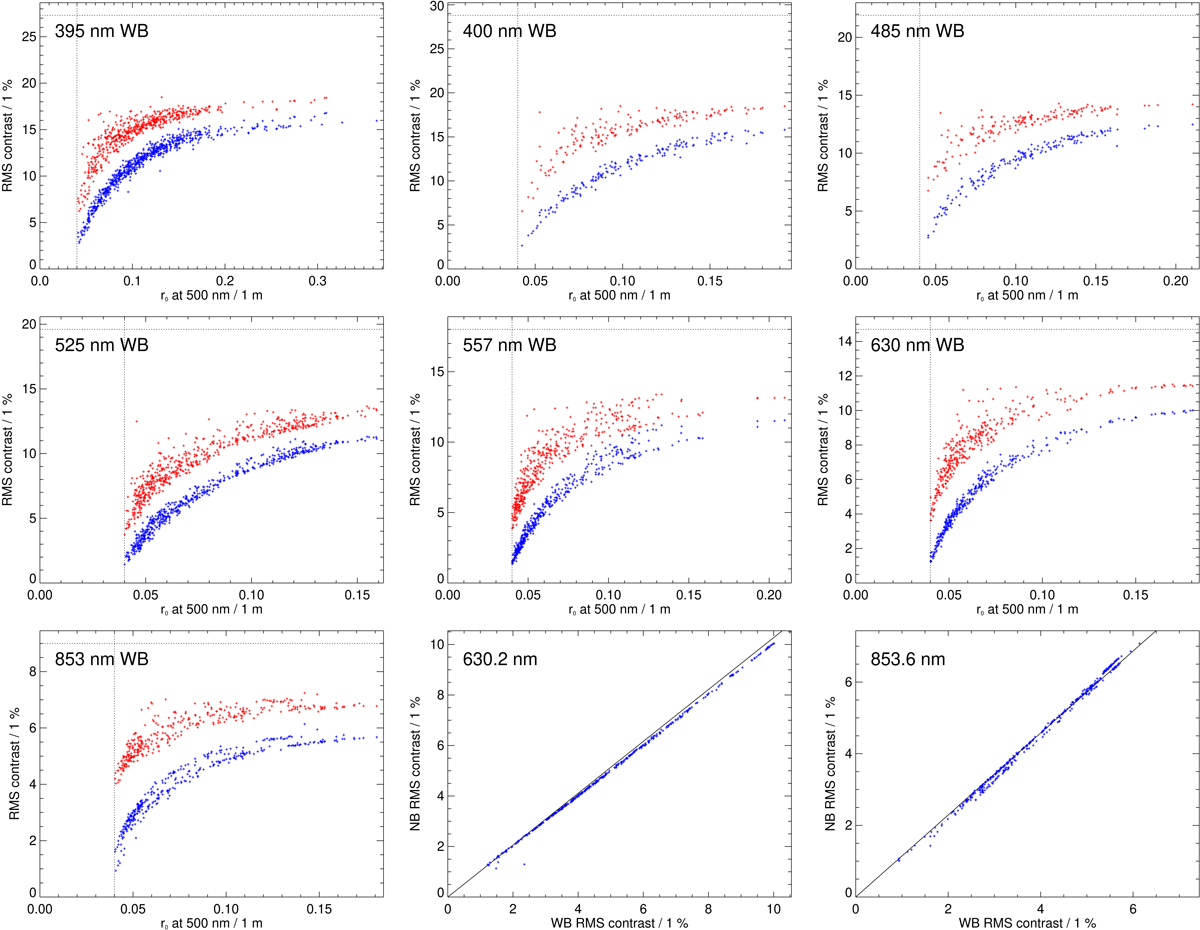
RMS contrast of granulation measured from SST images recorded at different wavelengths and in different seeing conditions characterized by the Fried r0 parameter. Both r0 and the granulation contrast have been averaged over 2 s. The blue dots refer to RMS contrasts of images recorded with the AO system and that are compensated only for the diffraction limited point spread function, the red dots to RMS contrasts of images further compensated for aberrations with the multi-frame blind deconvolution method (Löfdahl 2002), and the horizontal dotted lines show the contrasts of 3D MHD simulations. Images were recorded with wide-band (WB) filters on both the “red” (CRISP) and “blue” (CHROMIS) beams. Note that the plot limits for r0 vary from one plot to another and that data for r0 values smaller than 0.04 m, shown as vertical dotted lines, are excluded. Two of the panels in the lowermost row show a comparison between RMS contrast obtained from images recorded simultaneously through wideband pre-filters (labeled WB) and the corresponding narrowband (NB) CRISP spectropolarimeter filter system on the “red” beam of the SST (see text). The significantly higher contrast of the NB beam at 853.6 nm is because of the strong influence of the Ca 854.2 nm line within the passband of the WB filter.
Current usage metrics show cumulative count of Article Views (full-text article views including HTML views, PDF and ePub downloads, according to the available data) and Abstracts Views on Vision4Press platform.
Data correspond to usage on the plateform after 2015. The current usage metrics is available 48-96 hours after online publication and is updated daily on week days.
Initial download of the metrics may take a while.