Fig. 2.
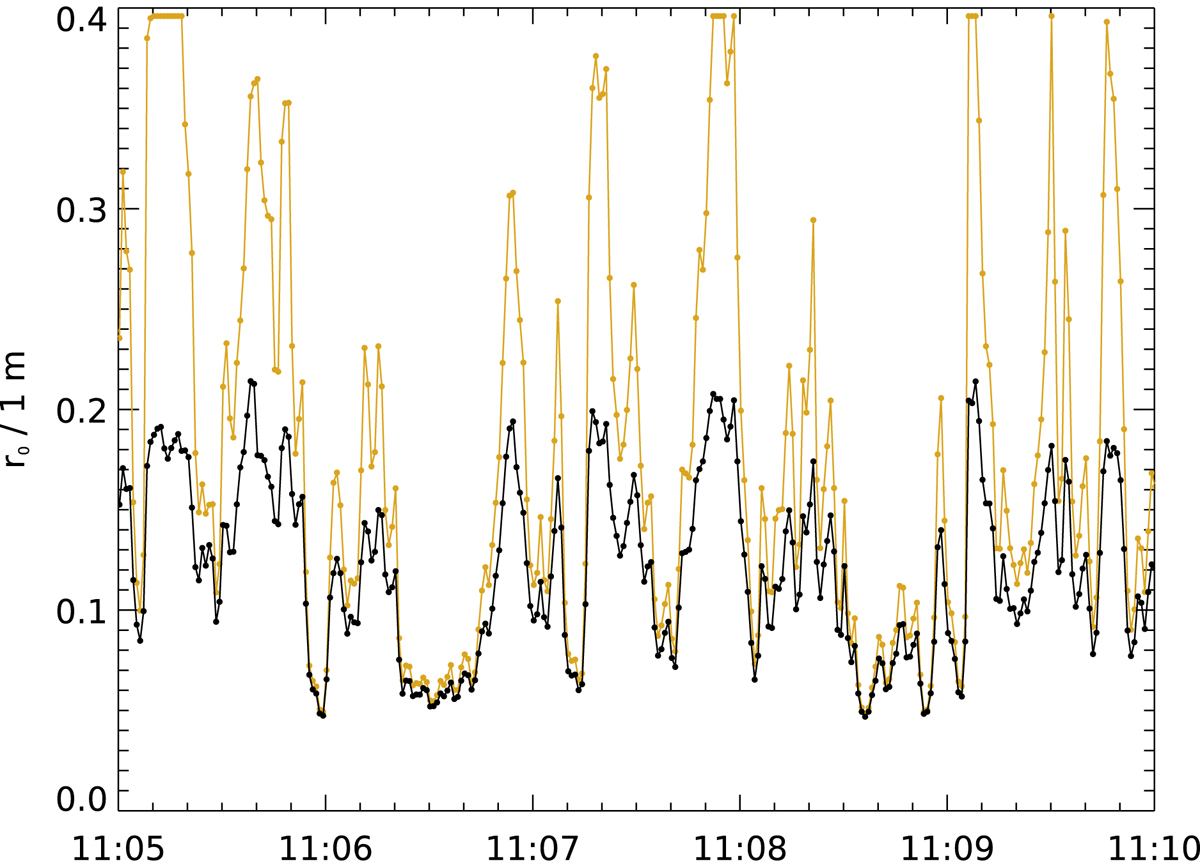
Yellow curve, which is saturated in some peaks, shows the time variation of the SST seeing quality (Fried’s parameter r0) as measured with the 12![]() 0 × 12
0 × 12![]() 0 WFS of the SST AO system, and the black curve shows the corresponding variations measured with a much smaller FOV of 4
0 WFS of the SST AO system, and the black curve shows the corresponding variations measured with a much smaller FOV of 4![]() 0 × 4
0 × 4![]() 0. The yellow curve corresponds roughly to ground-layer seeing and the black curve to a combination of ground- and high-altitude seeing (see text). We note the strong intermittency that requires high time resolution. The data were recorded on 13 May 2016.
0. The yellow curve corresponds roughly to ground-layer seeing and the black curve to a combination of ground- and high-altitude seeing (see text). We note the strong intermittency that requires high time resolution. The data were recorded on 13 May 2016.
Current usage metrics show cumulative count of Article Views (full-text article views including HTML views, PDF and ePub downloads, according to the available data) and Abstracts Views on Vision4Press platform.
Data correspond to usage on the plateform after 2015. The current usage metrics is available 48-96 hours after online publication and is updated daily on week days.
Initial download of the metrics may take a while.