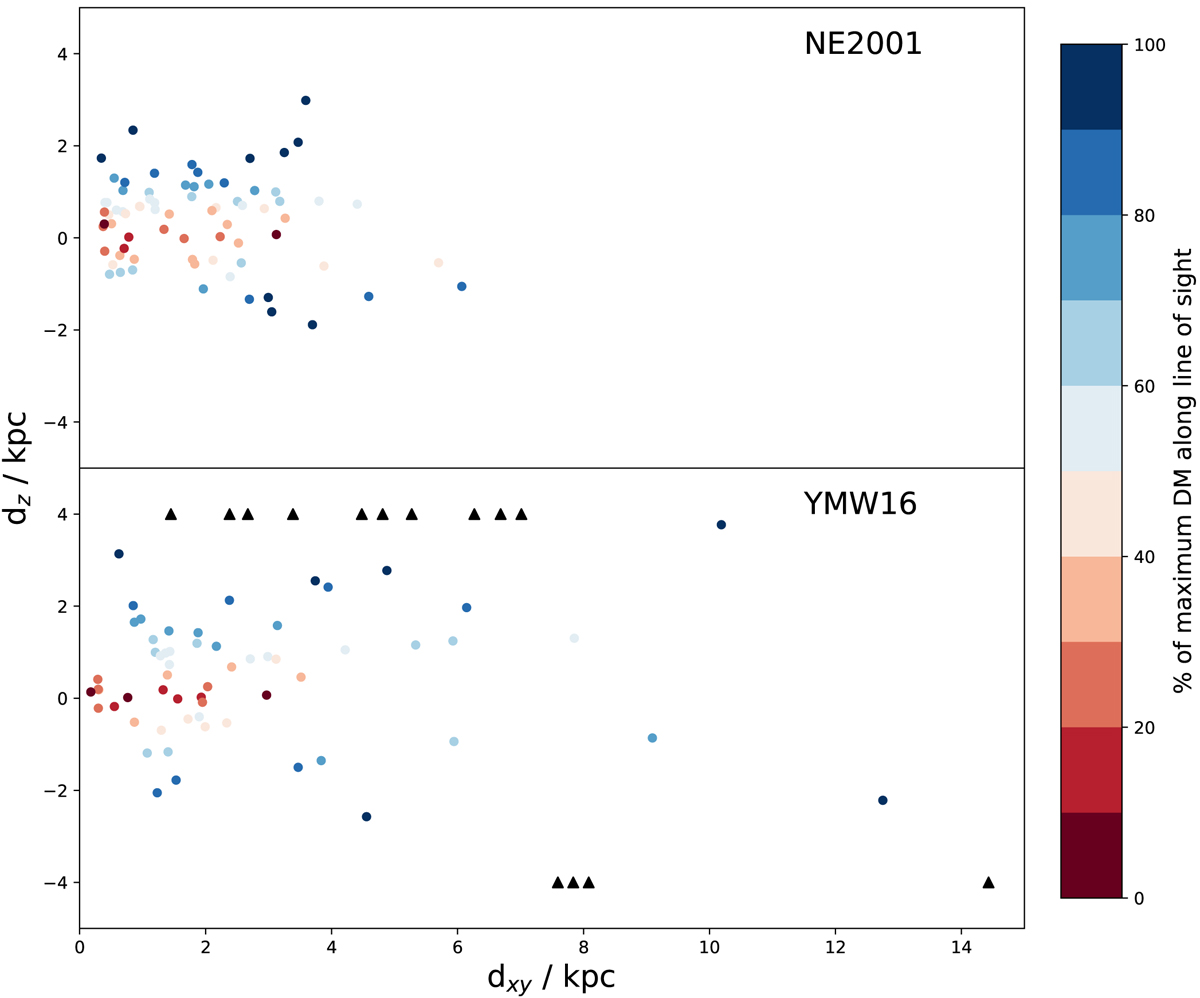
Fig. 9.

Distances of LOTAAS discoveries above/below the Galactic plane versus their distance along the Galactic plane, as predicted by the NE2001 (Cordes & Lazio 2002) and YMW16 (Yao et al. 2017) models for the Galactic free electron density distribution. The colour of each point denotes the DM of the pulsar compared to the maximum predicted DM along the particular line-of-sight. The pulsars for which the YMW16 model predicts maximum DMs less than the observed DMs are plotted with black triangles, where the distances to the pulsars are fixed at a limit of 4 kpc above or below the Galactic plane.
Current usage metrics show cumulative count of Article Views (full-text article views including HTML views, PDF and ePub downloads, according to the available data) and Abstracts Views on Vision4Press platform.
Data correspond to usage on the plateform after 2015. The current usage metrics is available 48-96 hours after online publication and is updated daily on week days.
Initial download of the metrics may take a while.


