Fig. 3.
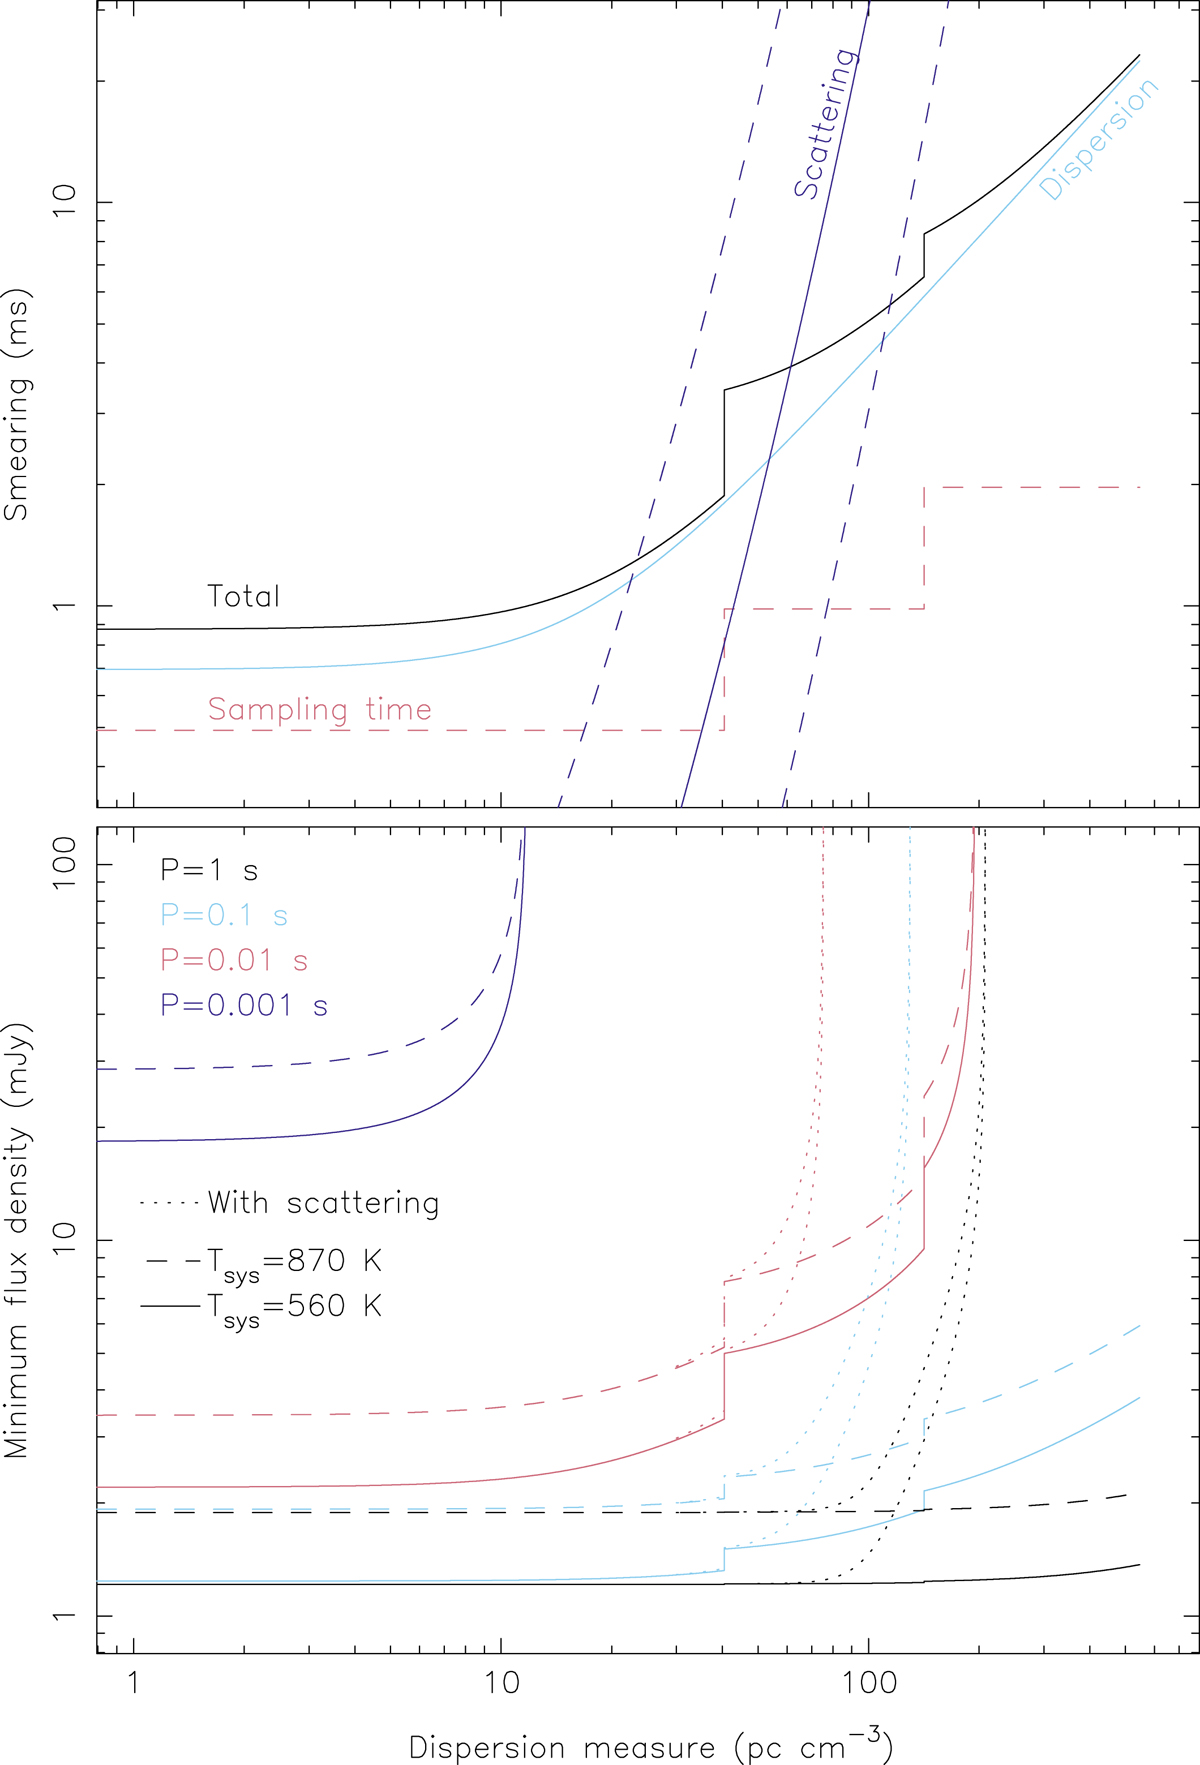
Top: pulse broadening due to the finite sampling time, dispersive smearing due to the incoherent dedispersion algorithm used, and the effects of scattering using the scattering relation of Bhat et al. (2004). The diagonal dashed lines denote a one order-of-magnitude larger or smaller range in predicted scattering. Bottom: minimum detectable flux density for the LOTAAS survey as a function of DM. Sensitivity limits are plotted for different pulse periods P, and different system temperatures Tsys. The effect of pulse broadening due to interstellar scattering is shown by the dotted lines.
Current usage metrics show cumulative count of Article Views (full-text article views including HTML views, PDF and ePub downloads, according to the available data) and Abstracts Views on Vision4Press platform.
Data correspond to usage on the plateform after 2015. The current usage metrics is available 48-96 hours after online publication and is updated daily on week days.
Initial download of the metrics may take a while.