Fig. 2.
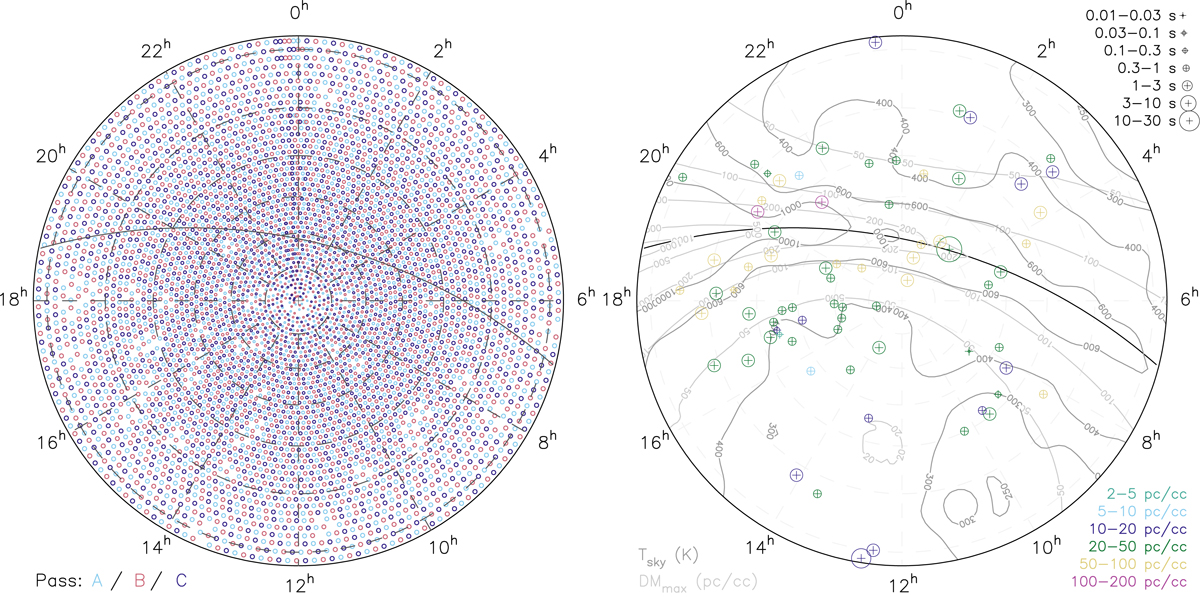
Stereographic projections of the Northern hemisphere in equatorial coordinates (δ > −3°). Lines of equal right ascension and declination are indicated with dashed gray lines (2h steps in RA and 15° in Dec, from 0° to 75°). The Galactic plane is shown as the black curve. Left: observed LOTAAS pointings as of January 2019, following the LOTAAS tessellation scheme. The sky coverage of the incoherent beams is shown for the three passes with different colours. Note that beamsizes have been scaled down for readability of the plot. Right: sky location of the first 73 LOTAAS pulsar discoveries. The period P and dispersion measure DM of the pulsars are indicated with different symbols and colours. Contours show the sky temperature Tsky at 135 MHz, as extrapolated from the Haslam et al. (1982) 408 MHz map, as well as the maximum predicted DM within our Galaxy by the Cordes & Lazio (2002) NE2001 model.
Current usage metrics show cumulative count of Article Views (full-text article views including HTML views, PDF and ePub downloads, according to the available data) and Abstracts Views on Vision4Press platform.
Data correspond to usage on the plateform after 2015. The current usage metrics is available 48-96 hours after online publication and is updated daily on week days.
Initial download of the metrics may take a while.