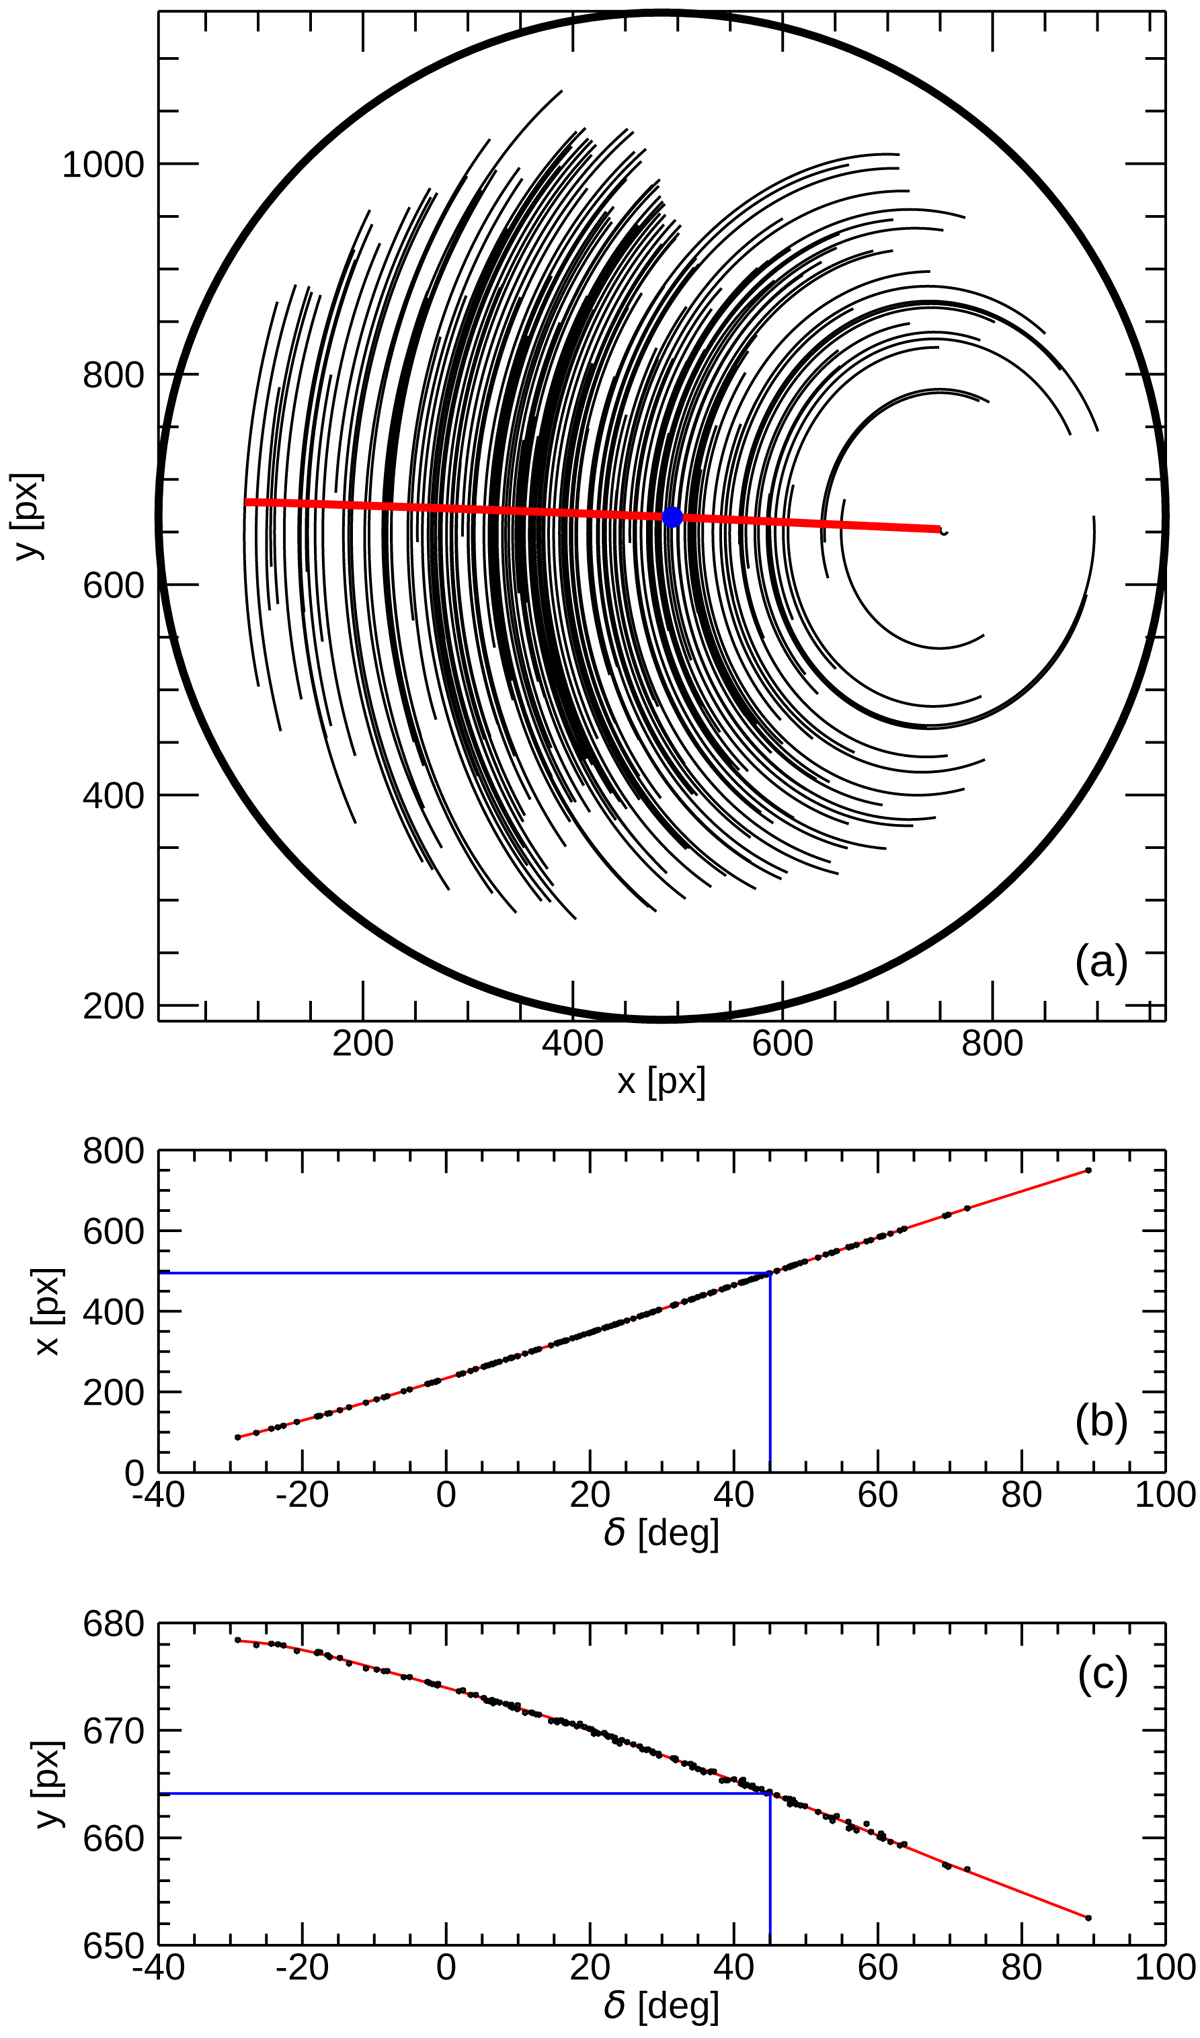
Fig. 6.

Example of the determination of the local meridian and zenith positions with data of the night on 5 January 2017 of the Pino Torinese station: (a) local meridian (solid red line) and zenith position (blue dot) on the CCD, identified by the interpolation of the stellar trajectories (black lines); (b) declination vs. x pixels of the observed crossings of the local meridian (black dots), spline interpolation (red line) and evaluation of xZ value (blue); (c) same as (b), but for yZ determination.
Current usage metrics show cumulative count of Article Views (full-text article views including HTML views, PDF and ePub downloads, according to the available data) and Abstracts Views on Vision4Press platform.
Data correspond to usage on the plateform after 2015. The current usage metrics is available 48-96 hours after online publication and is updated daily on week days.
Initial download of the metrics may take a while.


