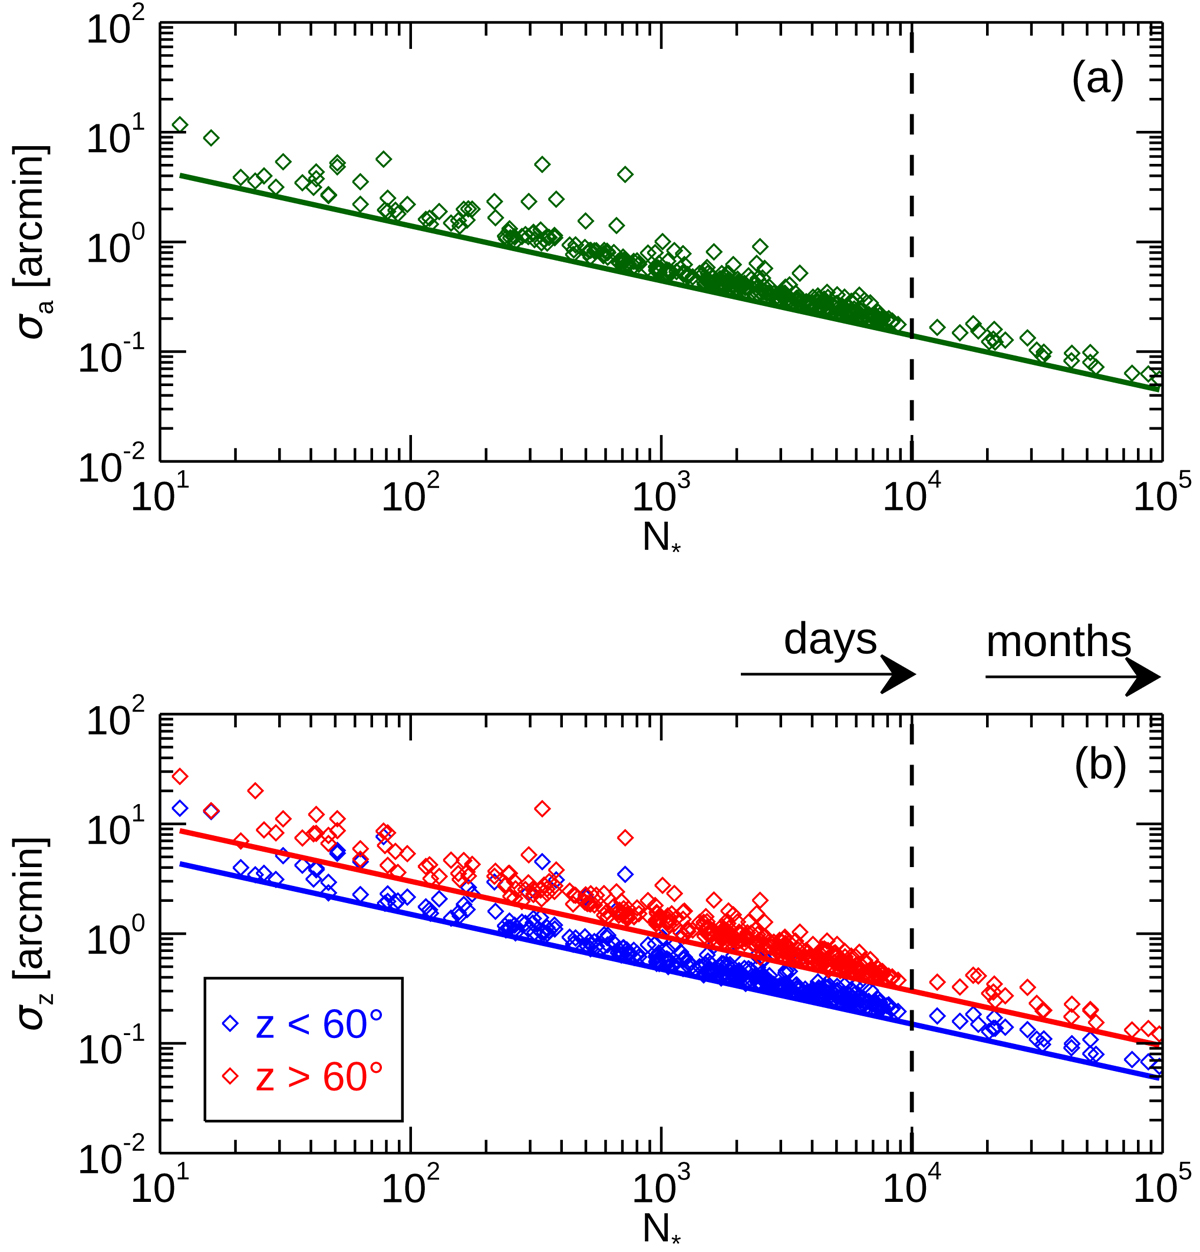
Fig. 12.

Azimuth (a) and zenith distance (b) random projection errors as a function of the calibration sample size (N*). For zenith distance, the data are presented for z < 60° (blue) and z > 60° (red) separately to outline the plate scale degradation close to the horizon, whereas azimuth data (green) do not show any systematic dependence. The points represent the daily and monthly data, and the straight lines show the square root dependence.
Current usage metrics show cumulative count of Article Views (full-text article views including HTML views, PDF and ePub downloads, according to the available data) and Abstracts Views on Vision4Press platform.
Data correspond to usage on the plateform after 2015. The current usage metrics is available 48-96 hours after online publication and is updated daily on week days.
Initial download of the metrics may take a while.


