Fig. 3.
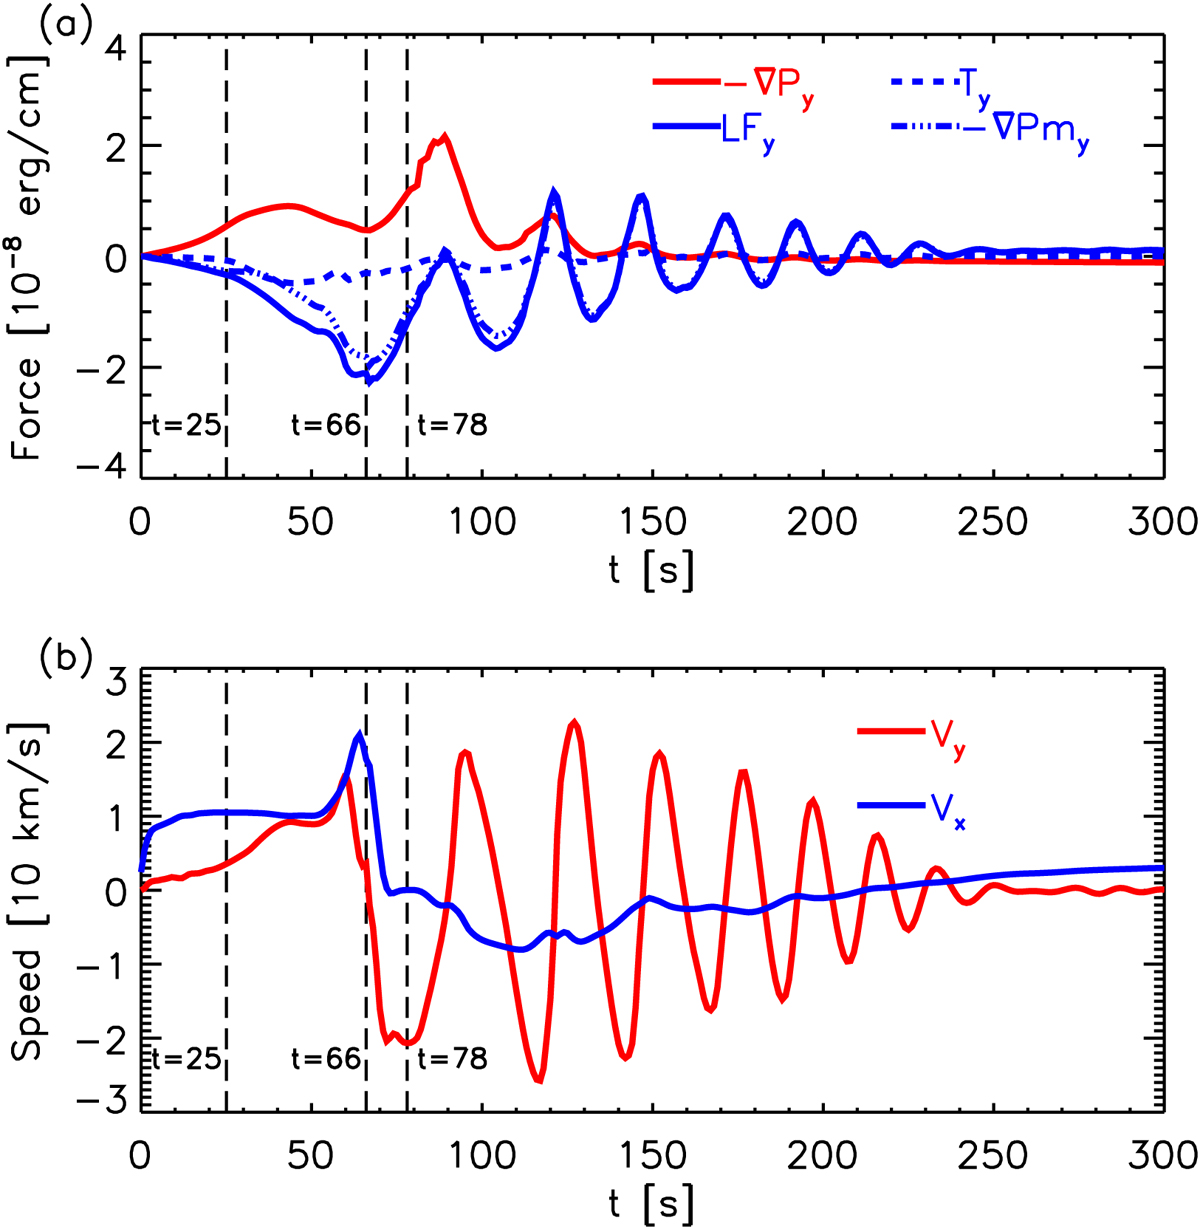
Panel a: evolution of the y-axis components of the gas pressure gradient (−∇Py, red solid curve), Lorentz force (LFy, blue solid curve), magnetic tension (Ty, blue dashed curve), and magnetic pressure gradient (−∇Pmy, blue dash-dotted curve) averaged over the rectangular region shown in Fig. 2. Panel b: evolution of the x- and y-axis components of the velocity averaged over the rectangular region shown in Fig. 2.
Current usage metrics show cumulative count of Article Views (full-text article views including HTML views, PDF and ePub downloads, according to the available data) and Abstracts Views on Vision4Press platform.
Data correspond to usage on the plateform after 2015. The current usage metrics is available 48-96 hours after online publication and is updated daily on week days.
Initial download of the metrics may take a while.