Fig. 21.
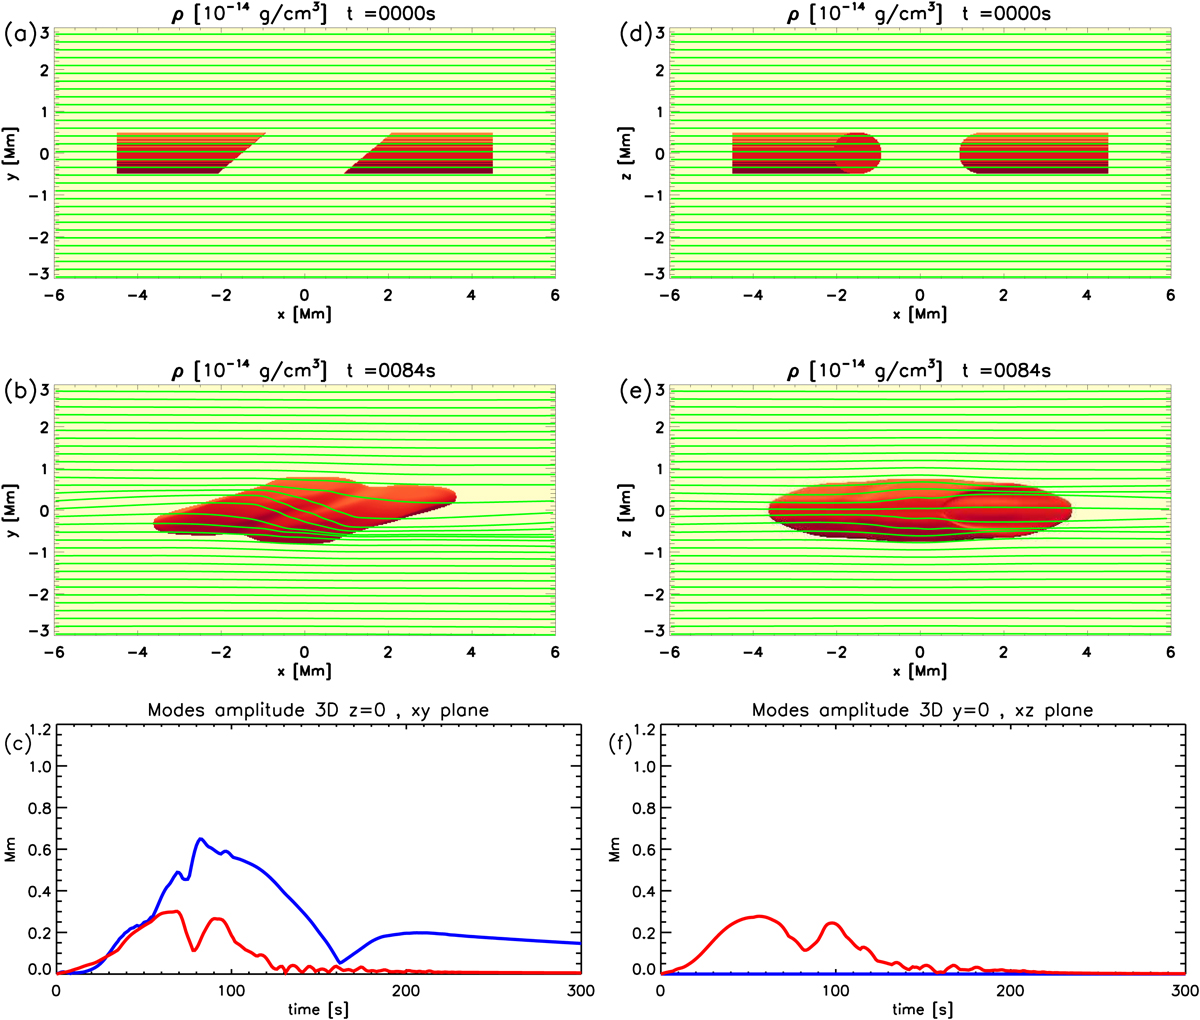
Panels a and d: initial density contour projected on the xy-plane and on the xz-plane, respectively. Panels b and e: same contours at t = 84 s. Green lines are magnetic field lines drawn from the left-hand boundary. Evolution of the functions K(t) (blue lines) and S(t) (red lines) for the 3D MHD simulation on the z = 0 (panel c) and y = 0 planes (panel f). A movie is available online.
Current usage metrics show cumulative count of Article Views (full-text article views including HTML views, PDF and ePub downloads, according to the available data) and Abstracts Views on Vision4Press platform.
Data correspond to usage on the plateform after 2015. The current usage metrics is available 48-96 hours after online publication and is updated daily on week days.
Initial download of the metrics may take a while.