Fig. A.1
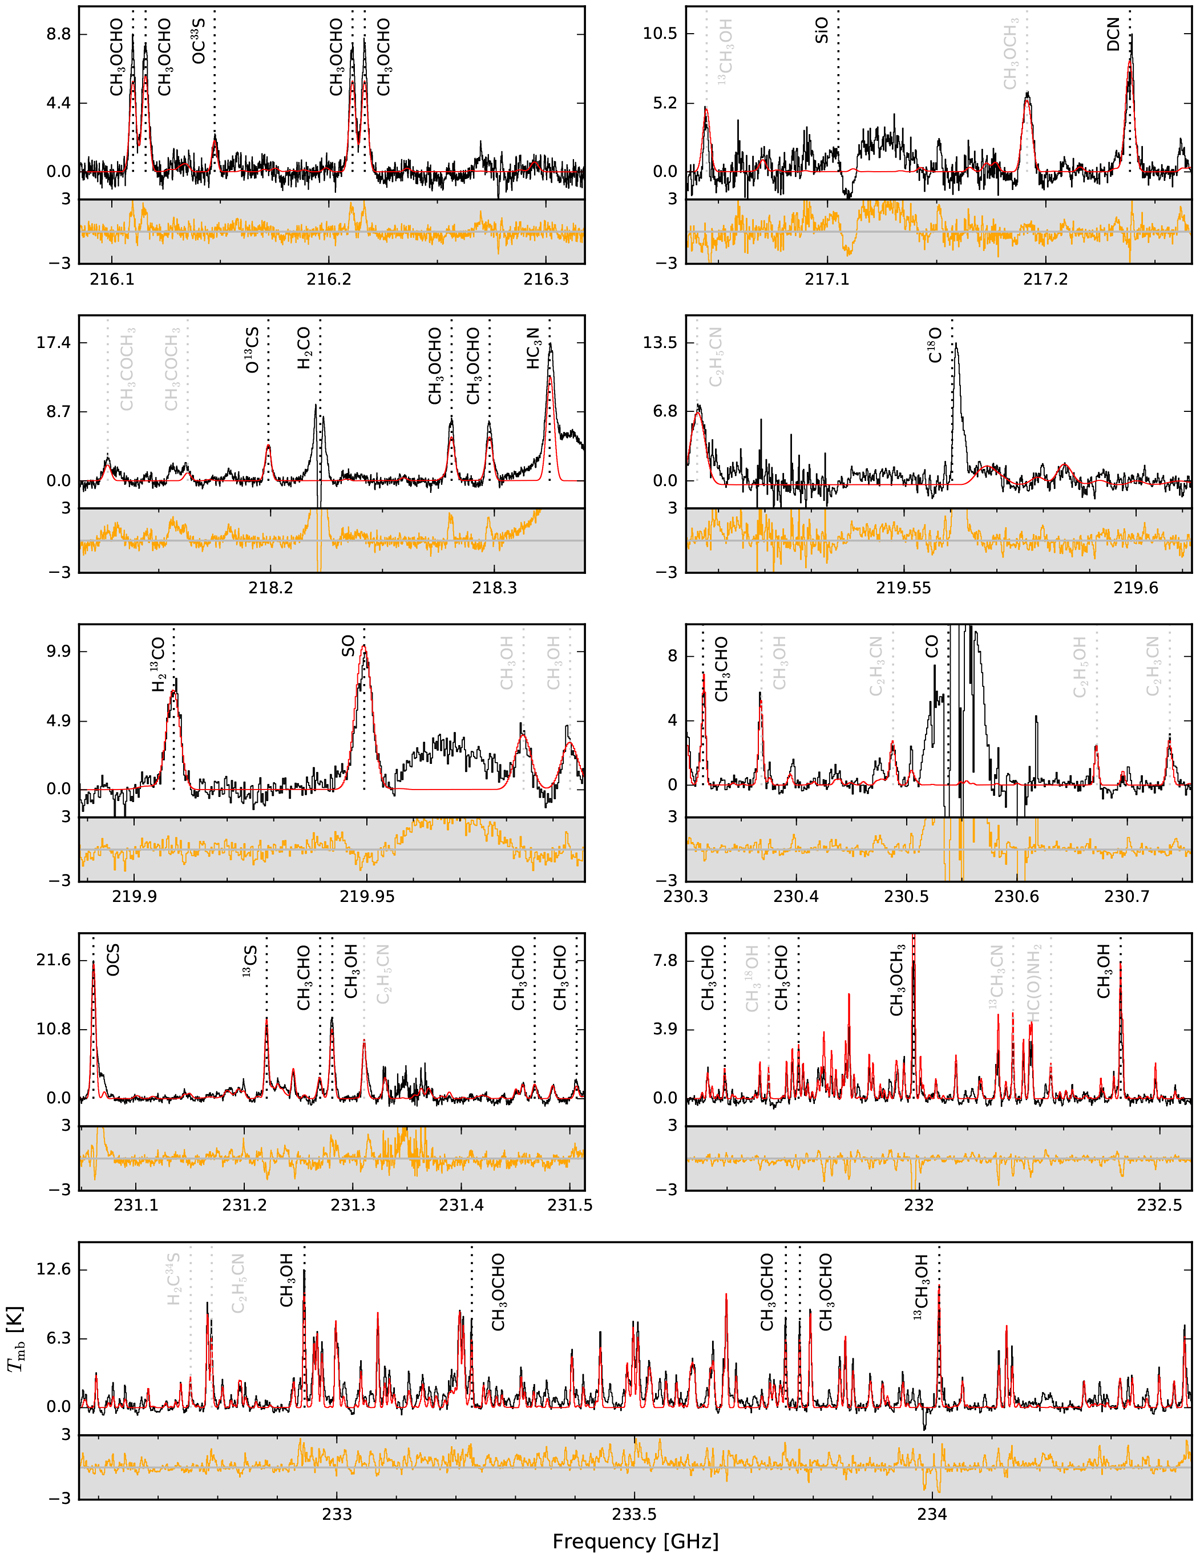
Observed spectra (in black), synthetic spectra (in red) and residuals (in orange) towards core #3 for all the ALMA bands. The observed spectra are integrated over the continuum cores (see Table 2). All the molecular lines detected in core #6 (see Table A.2) are indicated by black dotted lines and some of the additional molecular lines detected in core #3 are indicated in grey. The parameters used for the synthetic spectra are listed in Table 3. The Cycle 3 spectral band Cont. 1, which overlaps with Cycle 2 data Cont. 2, is ignored here.
Current usage metrics show cumulative count of Article Views (full-text article views including HTML views, PDF and ePub downloads, according to the available data) and Abstracts Views on Vision4Press platform.
Data correspond to usage on the plateform after 2015. The current usage metrics is available 48-96 hours after online publication and is updated daily on week days.
Initial download of the metrics may take a while.