Fig. 6
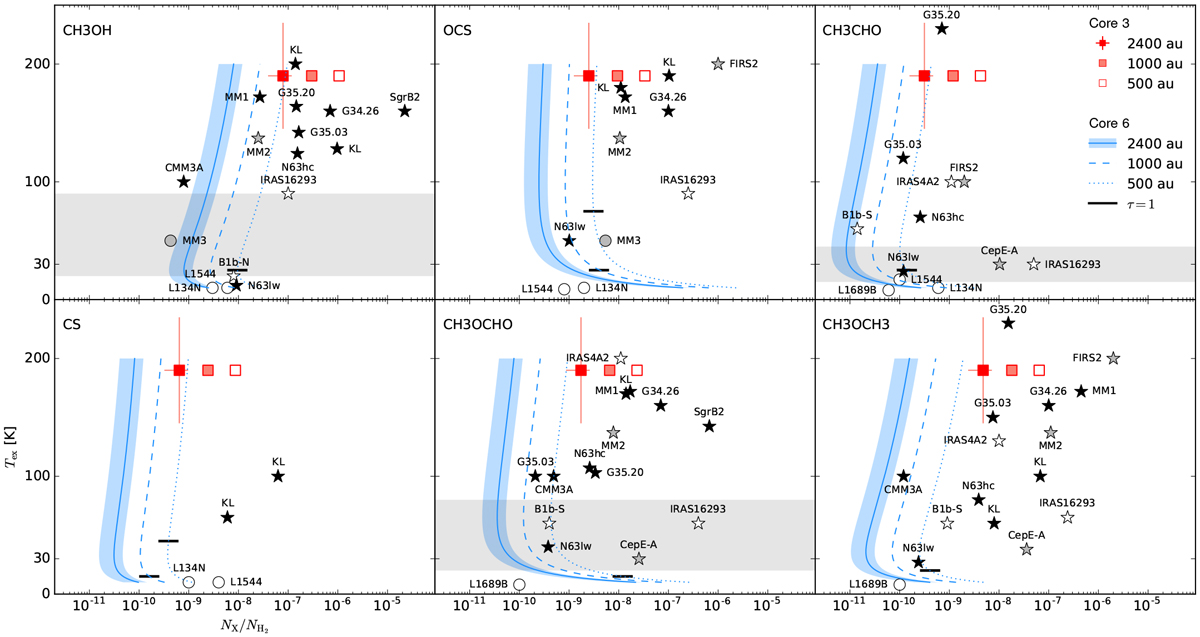
Abundances with respect to H2 for selected molecules. Results for core #3 (red squares) and core #6 (blue lines) considering different source sizes (see legend) are from LTE modelling. The temperature Tex = 190 K is fixed for core #3, it varies from 10 to 200 K for core #6. The blue area represents an error of 50% on the estimation of the abundance, which includes the error on the line area and on the value of NH_2. The grey area is the temperature range estimated for core #6 from the rotational diagrams. For a given size, a molecule becomes optically thick below the black line. The sources listed in Table 4 are represented by a dot for prestellar cores or a star for protostellar cores. The colour code is white for low-mass, grey for intermediate-mass, and black for high-mass cores. The names refer to Col. 2 of Table 4.
Current usage metrics show cumulative count of Article Views (full-text article views including HTML views, PDF and ePub downloads, according to the available data) and Abstracts Views on Vision4Press platform.
Data correspond to usage on the plateform after 2015. The current usage metrics is available 48-96 hours after online publication and is updated daily on week days.
Initial download of the metrics may take a while.