Fig. 4
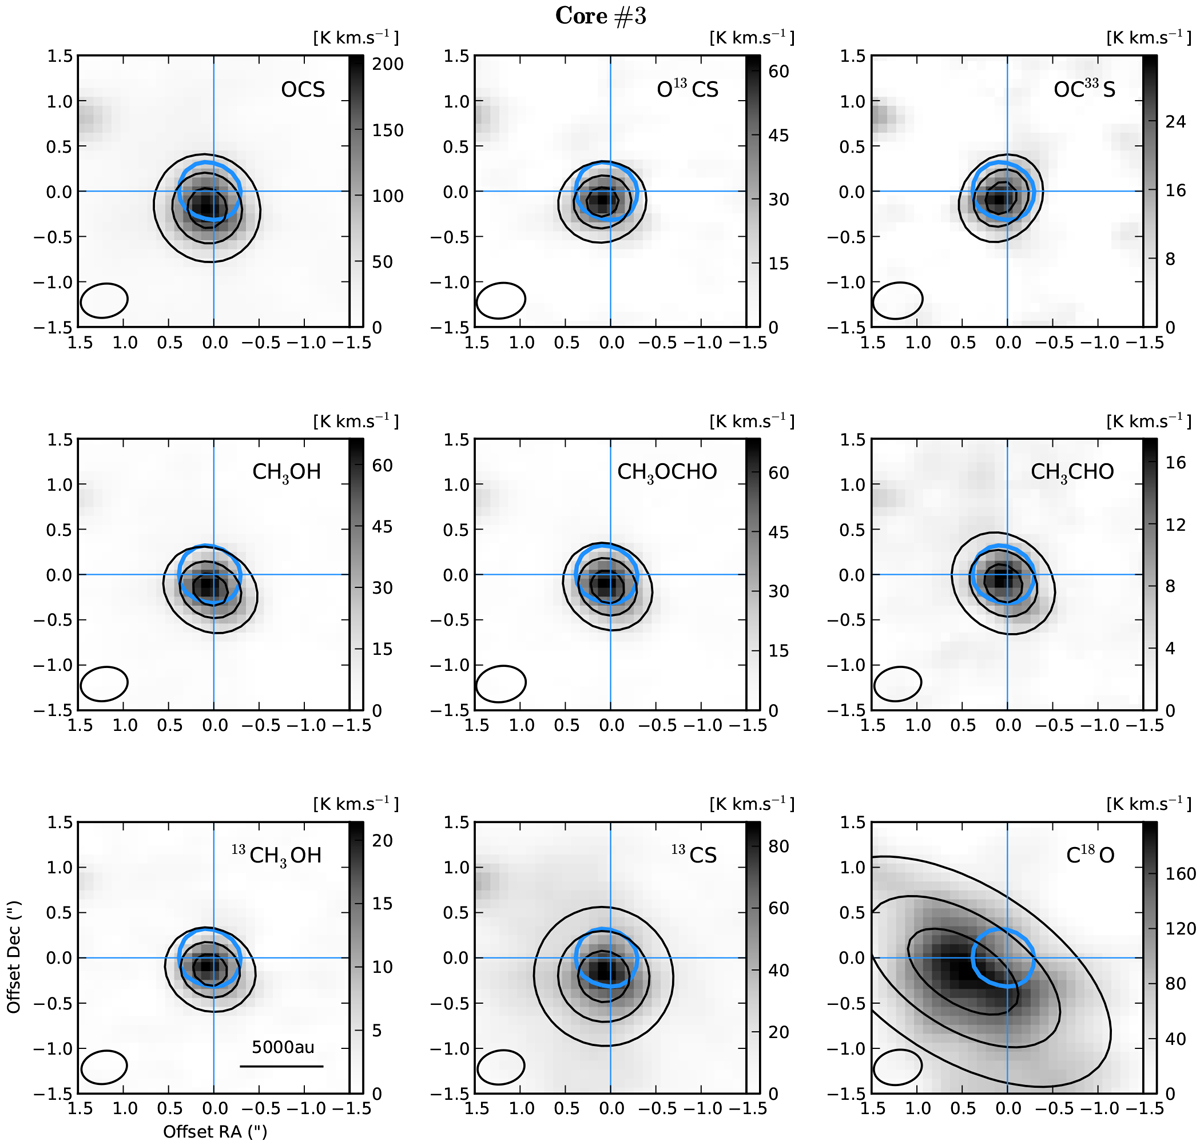
Velocity integrated intensity map (grey scale) around core #3 for the molecules centred on the continuum core. The velocity range chosen for the integration is 95–97 km s−1, which corresponds to the central emission peak. Temperature is the main beam brightness temperature Tmb. The black contours represent the result of a Gaussian fit to the emission; the levels are 20, 50, and 80% of the maximum. The maps are centred on the continuum core represented in blue contours (50% of the maximum). The beam is represented on the bottom left corner of each map.
Current usage metrics show cumulative count of Article Views (full-text article views including HTML views, PDF and ePub downloads, according to the available data) and Abstracts Views on Vision4Press platform.
Data correspond to usage on the plateform after 2015. The current usage metrics is available 48-96 hours after online publication and is updated daily on week days.
Initial download of the metrics may take a while.