Fig. 2
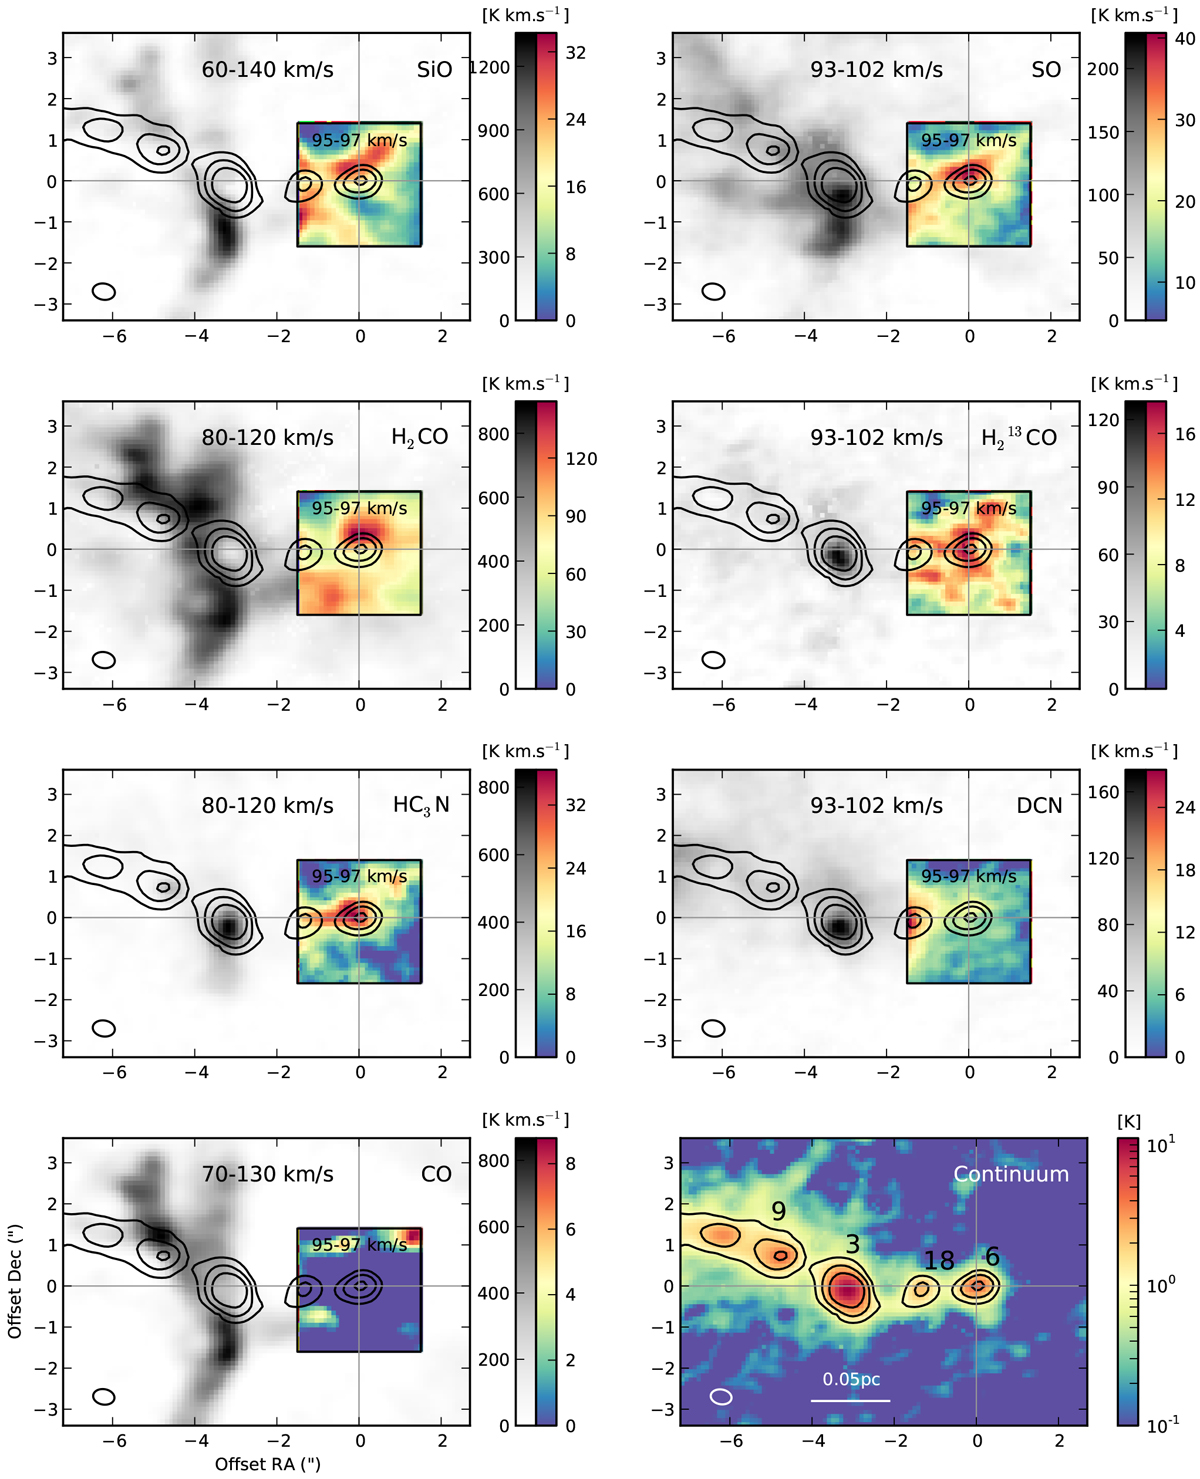
Velocity integrated maps of the molecules that do not peak on core #6. The velocity range is indicated on the top of each box. For each molecule, grey scale images correspond to the large-scale map with large dynamics in intensity, while the colour maps focus on a narrower region around core #6 with smaller dynamics in intensity (as indicated by the two wedges on the right side of each panel). Temperature is the main beam brightness temperature Tmb. The continuum map obtained from the Cont. 2 spectral window data is plotted in the bottom right panel. The contours represent the 5–10–20σ continuum emission, with 5σ ≈ 9mJy beam−1. The position is relative to the centre of the continuum core #6. The beam is represented in the bottom left corner of each map. The CO emission is completely filtered in the 95–97 km s−1 velocity range around core #6 (see Fig. A.2), but its presence is confirmed by the C18 O emission.
Current usage metrics show cumulative count of Article Views (full-text article views including HTML views, PDF and ePub downloads, according to the available data) and Abstracts Views on Vision4Press platform.
Data correspond to usage on the plateform after 2015. The current usage metrics is available 48-96 hours after online publication and is updated daily on week days.
Initial download of the metrics may take a while.