Fig. 2.
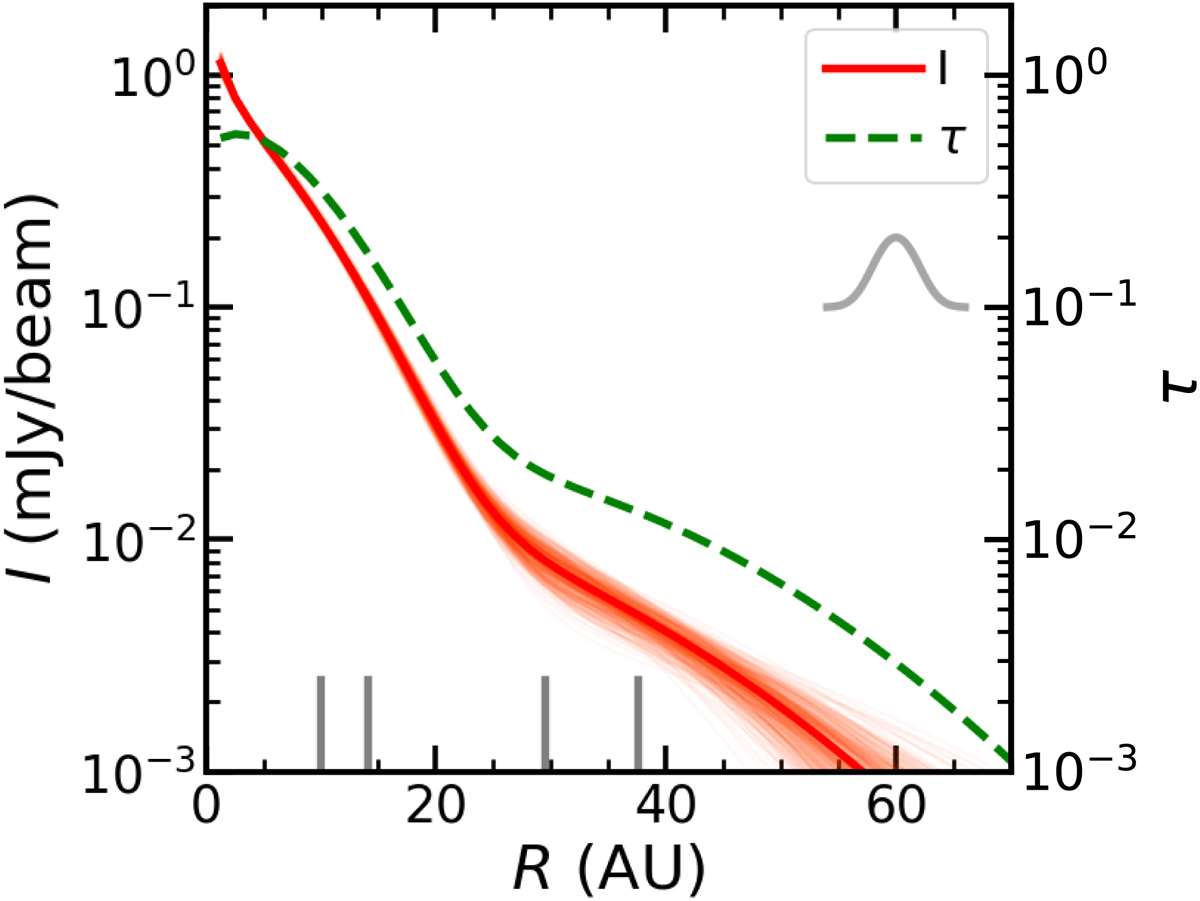
Intensity and optical depth profiles of the best fit model. The solid red line shows the best fit radial intensity profile of the continuum; 400 random realizations were chosen from the posterior distribution of the fit to highlight the uncertainties. The green dashed line indicates the optical depth profile of the continuum assuming the temperature profile from Eq. (2). The gray vertical lines show the radii enclosing 50%, 68%, 90%, and 95% of the total flux. The Gaussian in the top right corner has the same FWHM of the minor axis of the beam.
Current usage metrics show cumulative count of Article Views (full-text article views including HTML views, PDF and ePub downloads, according to the available data) and Abstracts Views on Vision4Press platform.
Data correspond to usage on the plateform after 2015. The current usage metrics is available 48-96 hours after online publication and is updated daily on week days.
Initial download of the metrics may take a while.