Free Access
Fig. 8.
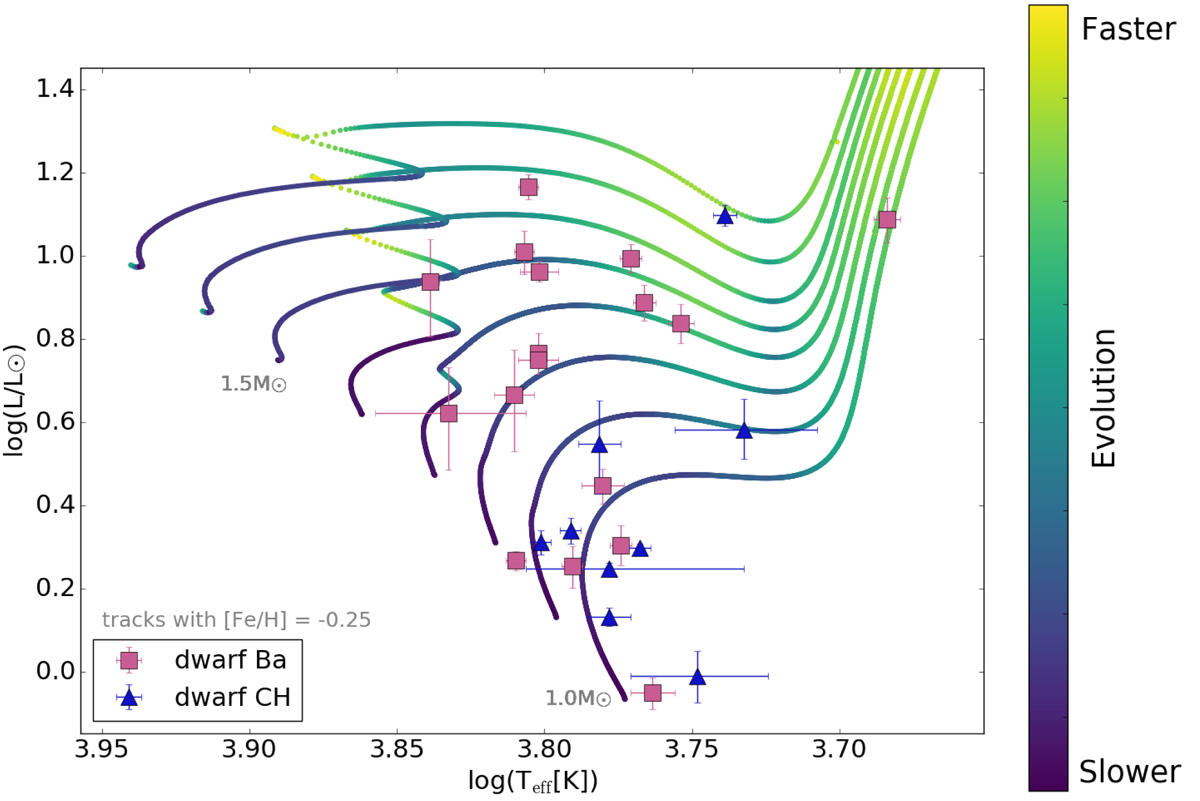
Same as the right panel of Fig. 7, but with stars of all metallicities included. The colour of the tracks is proportional to an evolutionary velocity computed as the distance between two points divided by the age difference between them. Dark blue colours trace much slower evolution than light green ones.
Current usage metrics show cumulative count of Article Views (full-text article views including HTML views, PDF and ePub downloads, according to the available data) and Abstracts Views on Vision4Press platform.
Data correspond to usage on the plateform after 2015. The current usage metrics is available 48-96 hours after online publication and is updated daily on week days.
Initial download of the metrics may take a while.