Fig. 13.
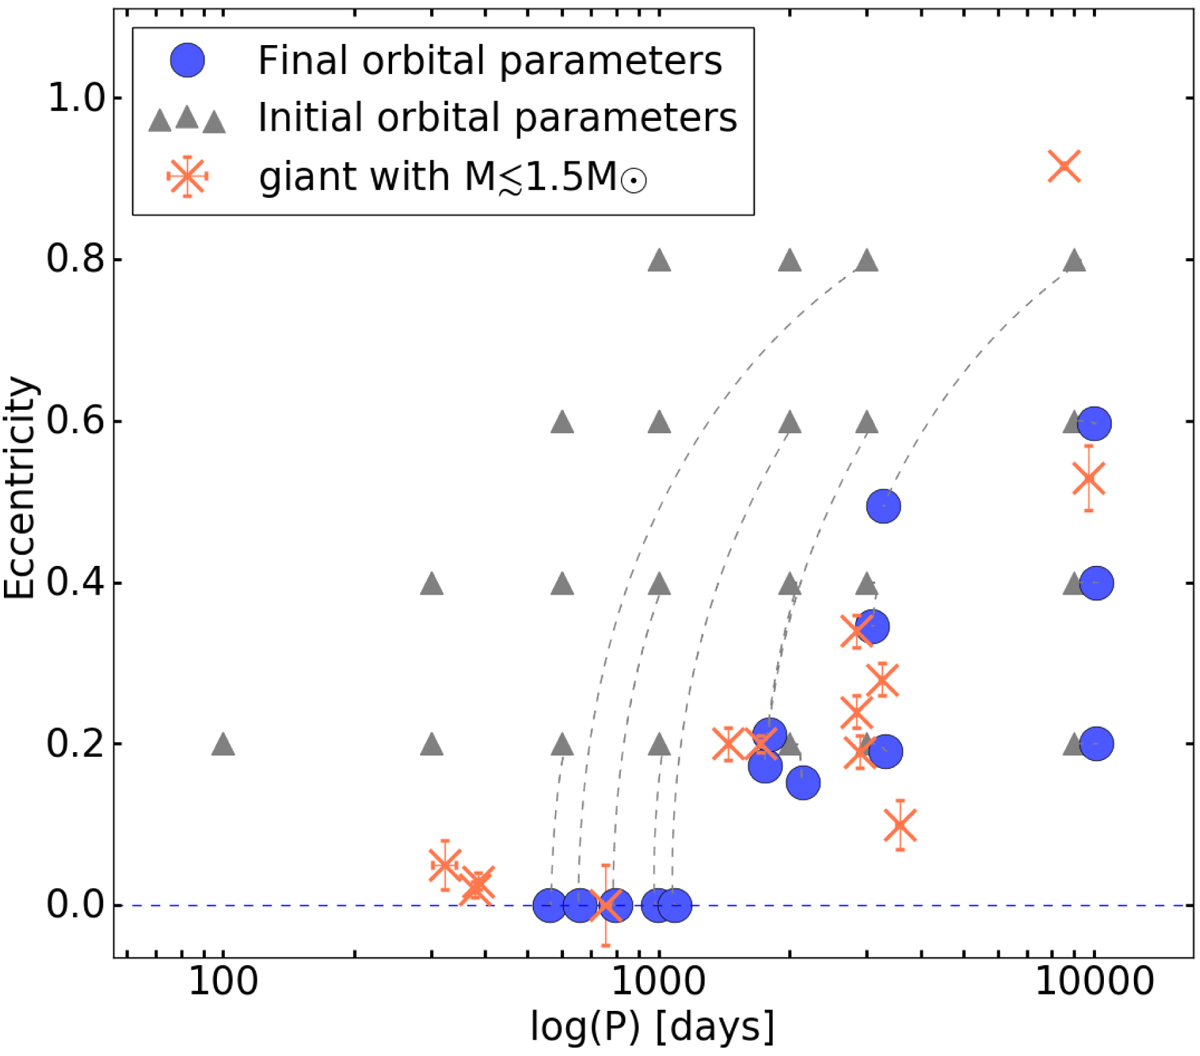
Observed and modelled orbits of Ba giants after the binary interaction along the RGB phase. The triangles indicate the initial period an eccentricity of each BINSTAR model and the blue dots indicate the final orbital parameters at the time of core-He burning onset. The evolution of the models that reached the core-He burning phase is represented by a dashed grey line. Orange crosses are observed orbits of low-mass (≲1.5 M⊙) Ba and CH giants from Jorissen et al. (2019).
Current usage metrics show cumulative count of Article Views (full-text article views including HTML views, PDF and ePub downloads, according to the available data) and Abstracts Views on Vision4Press platform.
Data correspond to usage on the plateform after 2015. The current usage metrics is available 48-96 hours after online publication and is updated daily on week days.
Initial download of the metrics may take a while.