Fig. 4
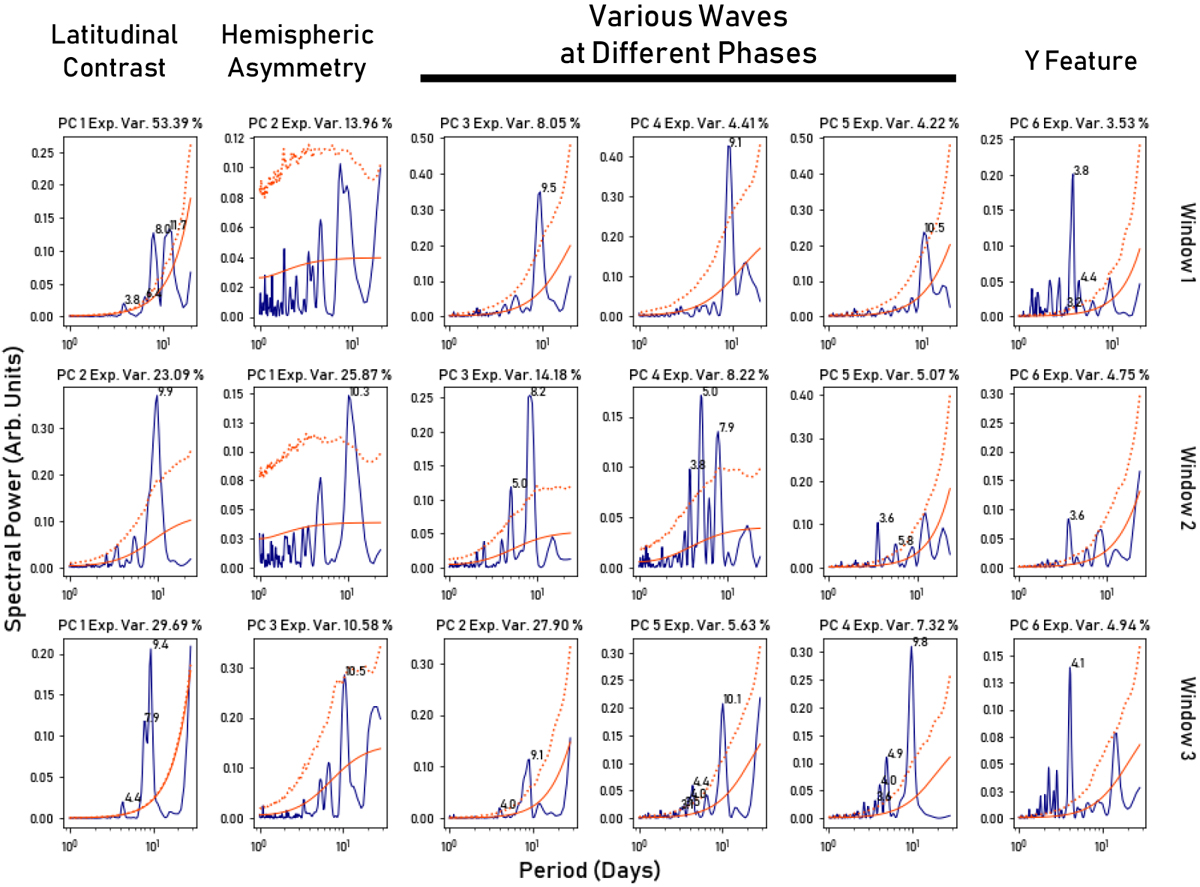
Lomb-Scargle periodograms for the loadings corresponding to the first six PCs for three windows at 283 nm. The numbers given for the spectral peaks indicate the associated periods. The solid red line is the average spectral power of red noise, while the dotted red line shows the 95% confidence limit of the distribution from 1000 Monte Carlo AR1 red noise processes. The explained variance fraction listed in the title of each subplot is calculated as the ratio of the eigenvalue of the mode to the sum of all eigenvalues from the covariance matrix, expressed as a percentage.
Current usage metrics show cumulative count of Article Views (full-text article views including HTML views, PDF and ePub downloads, according to the available data) and Abstracts Views on Vision4Press platform.
Data correspond to usage on the plateform after 2015. The current usage metrics is available 48-96 hours after online publication and is updated daily on week days.
Initial download of the metrics may take a while.