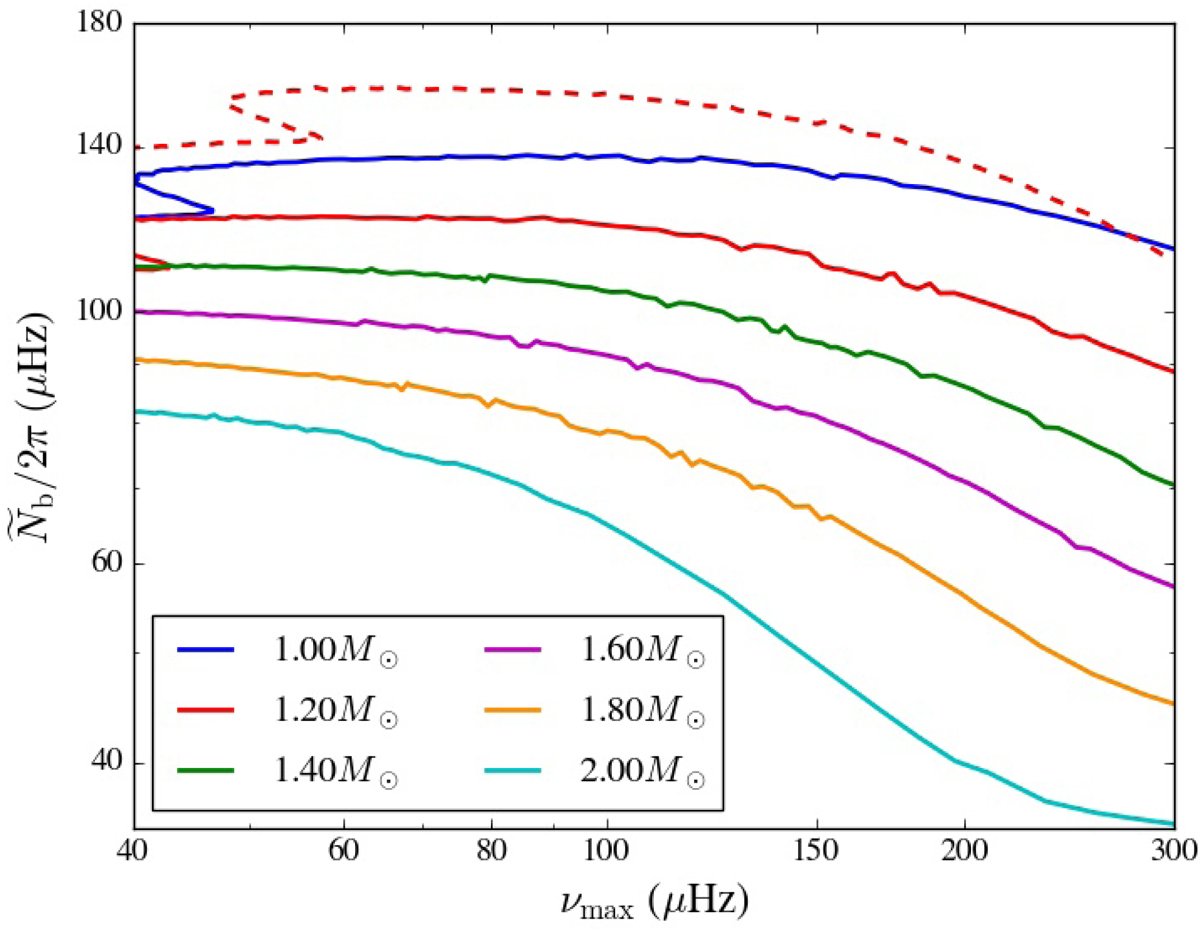
Fig. B.1.
Evolution of ![]() defined in Eq. (B.1) as a function of νmax for standard evolutionary sequences of models with different masses (solid lines). The red dashed line represents the result for a similar 1.2 M⊙ evolutionary sequence, except that a 0.3H-thick adiabatic overshooting region was included at the base of the convective zone.
defined in Eq. (B.1) as a function of νmax for standard evolutionary sequences of models with different masses (solid lines). The red dashed line represents the result for a similar 1.2 M⊙ evolutionary sequence, except that a 0.3H-thick adiabatic overshooting region was included at the base of the convective zone.
Current usage metrics show cumulative count of Article Views (full-text article views including HTML views, PDF and ePub downloads, according to the available data) and Abstracts Views on Vision4Press platform.
Data correspond to usage on the plateform after 2015. The current usage metrics is available 48-96 hours after online publication and is updated daily on week days.
Initial download of the metrics may take a while.