Fig. 1.
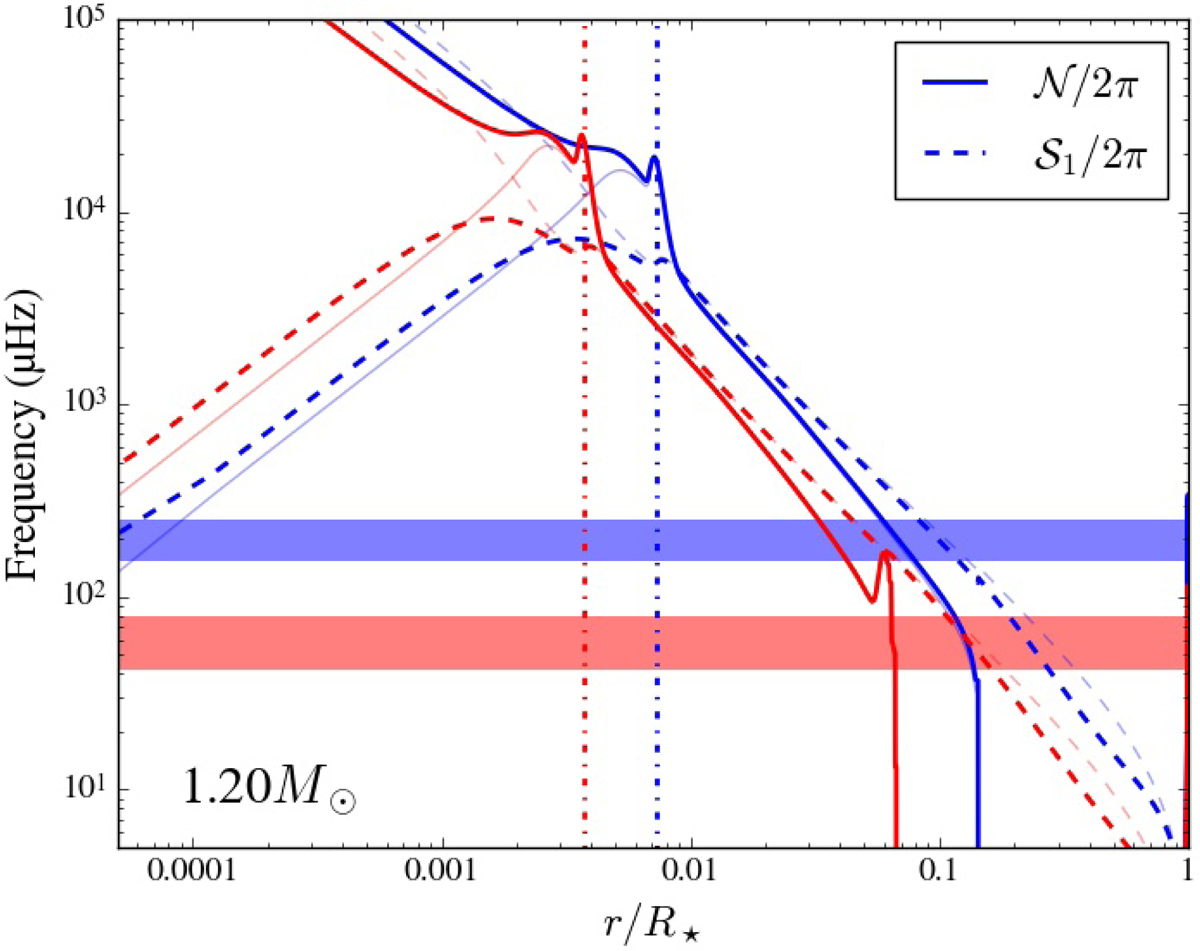
Profile of the modified Brunt–Väisälä and ℓ = 1 Lamb frequencies (thick solid and dashed lines, respectively) for two 1.2 M⊙ red giant models with νmax ≈ 200 μHz (blue) and νmax ≈ 60 μHz (red). These both models correspond to stars at the beginning of the ascent of the RGB and at a point just before the luminosity bump, respectively. The usual Brunt–Väisälä and ℓ = 1 Lamb frequencies, N and S1, are represented by the light thin solid and dashed lines, respectively. The vertical dash-dotted lines indicate the hydrogen-burning shell and the horizontal strip symbolizes a typical 6Δν-wide observed frequency range around νmax, for each model with the corresponding color. The buoyancy and acoustic cavities for a mode of frequency ν are located where 2πν ≤ (𝒩 and 𝒮1) and 2πν ≥ (𝒩 and 𝒮1), respectively.
Current usage metrics show cumulative count of Article Views (full-text article views including HTML views, PDF and ePub downloads, according to the available data) and Abstracts Views on Vision4Press platform.
Data correspond to usage on the plateform after 2015. The current usage metrics is available 48-96 hours after online publication and is updated daily on week days.
Initial download of the metrics may take a while.