Fig. 6
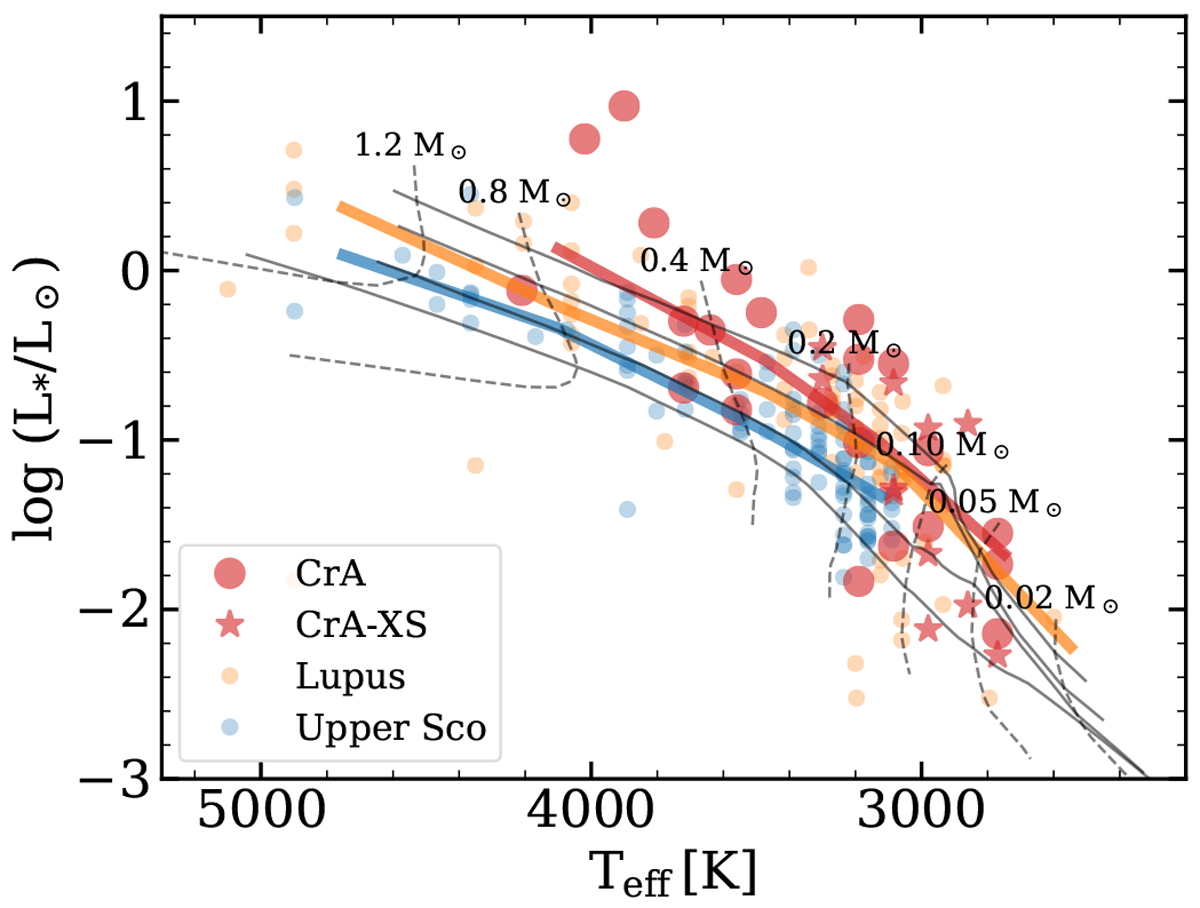
HR diagram showing the sources in our CrA sample (red), in the Lupus sample from Ansdell et al. (2016) (orange), and in the Upper Sco sample (blue) from Barenfeld et al. (2016). The evolutionary tracks for different stellar masses and the relative isochrones from Baraffe et al. (2015) are also plotted for reference. The isochrones refer (from top to bottom) to the 1, 2, 5, and 10 Myr isochrones. The colored solid lines show the approximate median value of the luminosity at each temperature.
Current usage metrics show cumulative count of Article Views (full-text article views including HTML views, PDF and ePub downloads, according to the available data) and Abstracts Views on Vision4Press platform.
Data correspond to usage on the plateform after 2015. The current usage metrics is available 48-96 hours after online publication and is updated daily on week days.
Initial download of the metrics may take a while.