Open Access
Fig. 1
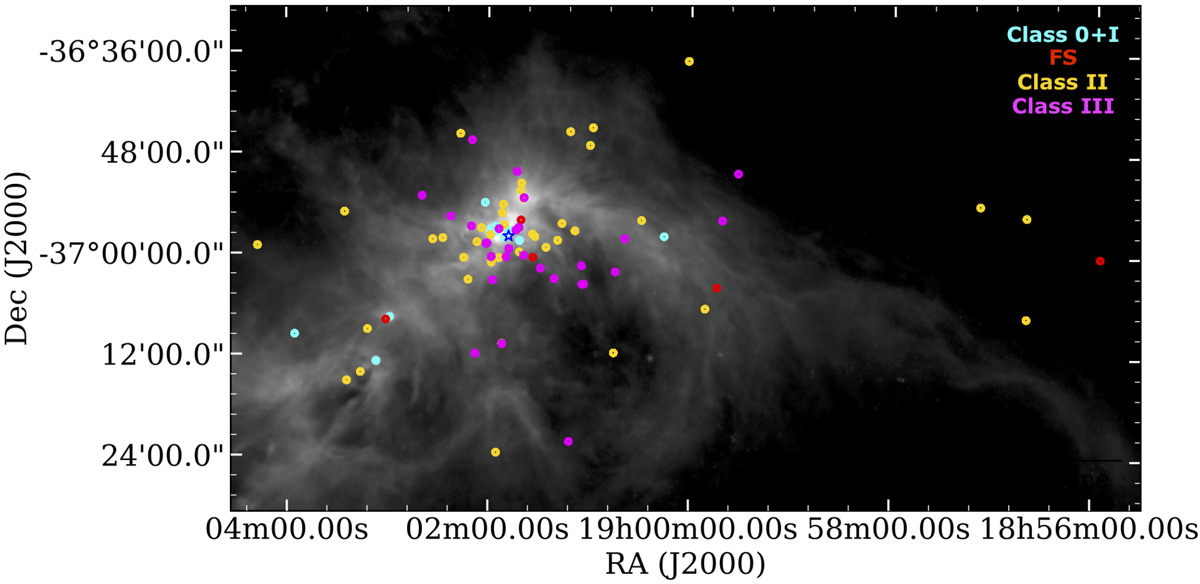
Spatial distribution of the CrA sources from the Peterson et al. (2011) catalog on top of the Herschel 250 μm map of the CrA molecular cloud. The different colors represent the classification of the YSOs. The blue star indicates the position of R CrA.
Current usage metrics show cumulative count of Article Views (full-text article views including HTML views, PDF and ePub downloads, according to the available data) and Abstracts Views on Vision4Press platform.
Data correspond to usage on the plateform after 2015. The current usage metrics is available 48-96 hours after online publication and is updated daily on week days.
Initial download of the metrics may take a while.