Fig. 7.
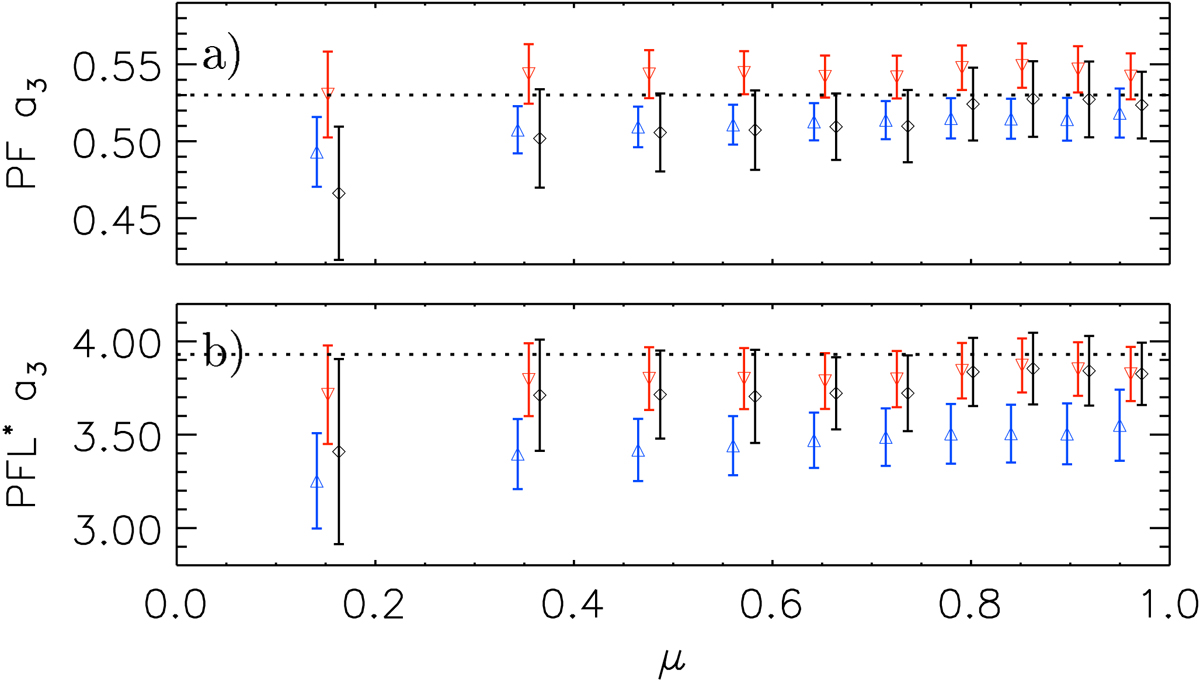
Parameters of the fits (Eq. (1)) as a function of μ, derived for ten annuli of equal area for all bright features (black), as well as for the network (blue), and plage (red) separately, for PF (panel a) and PFL* (panel b). The values shown are the means over the entire sample of data, while the error bars denote the 1σ interval. Results for the network are shown in the middle of the μ interval they represent, while the others are slightly shifted in μ to improve the clarity of the plot. The dotted lines mark the values of the best fit parameters derived in Sect. 3.1.
Current usage metrics show cumulative count of Article Views (full-text article views including HTML views, PDF and ePub downloads, according to the available data) and Abstracts Views on Vision4Press platform.
Data correspond to usage on the plateform after 2015. The current usage metrics is available 48-96 hours after online publication and is updated daily on week days.
Initial download of the metrics may take a while.