Fig. 6.
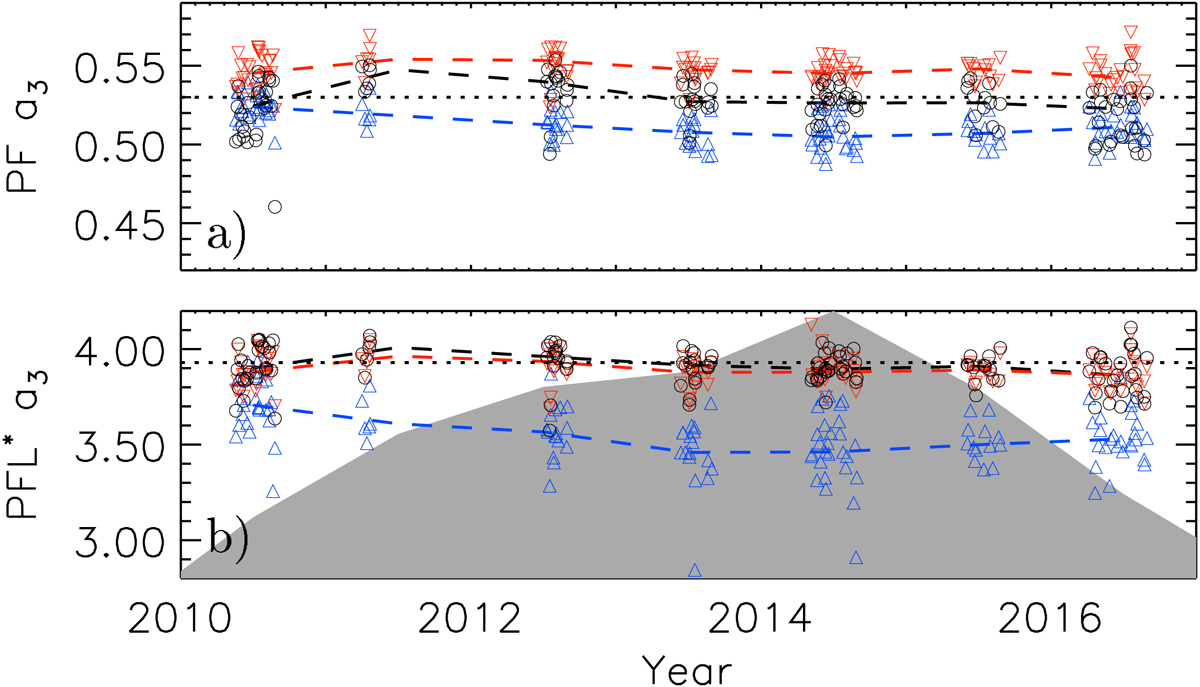
Parameters of the fits (Eq. (1)) as a function of time, derived for all bright features (black), as well as for the network (blue), and plage (red) separately, for PF (panel a) and PFL* (panel b) fits. The dashed lines connect the median values obtained from all analysed images within a given year, while the dotted lines mark the values of the parameters of the best fit derived in Sect. 3.1. The shaded grey surface in panel (b) shows the plage areas determined with Method 1 from the Rome/PSPT images. The areas were scaled to have a maximum value of 4.2 and minimum value 2.8 in order to match the range of values shown in panel (b); they indicate the level of solar activity at the considered times.
Current usage metrics show cumulative count of Article Views (full-text article views including HTML views, PDF and ePub downloads, according to the available data) and Abstracts Views on Vision4Press platform.
Data correspond to usage on the plateform after 2015. The current usage metrics is available 48-96 hours after online publication and is updated daily on week days.
Initial download of the metrics may take a while.