Fig. 5.
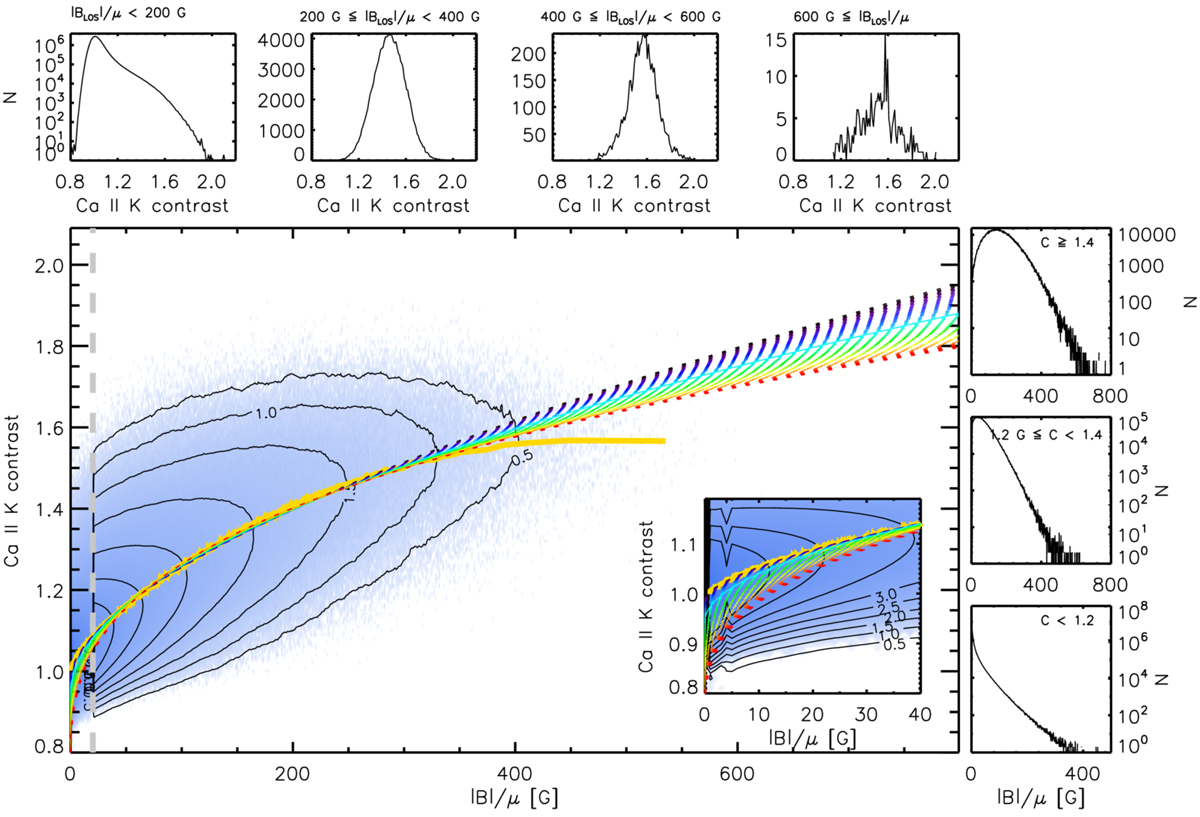
As in Fig. 3 but showing only the results of PF on the binned curve over |BLOS|/μ (yellow curve) by varying the |BLOS|/μ threshold, i.e. the magnetogram noise cut-off (dotted coloured curves). The threshold is 1 G for the black curve and rises to 50 G for the red curve. The curve corresponding to the 20 G threshold adopted in this study is shown with the light-blue solid curve. The thick yellow curve shows 5000-point running mean over |BLOS|/μ. The vertical grey dashed line denotes the 20 G threshold in |BLOS|/μ.
Current usage metrics show cumulative count of Article Views (full-text article views including HTML views, PDF and ePub downloads, according to the available data) and Abstracts Views on Vision4Press platform.
Data correspond to usage on the plateform after 2015. The current usage metrics is available 48-96 hours after online publication and is updated daily on week days.
Initial download of the metrics may take a while.