Fig. 4.
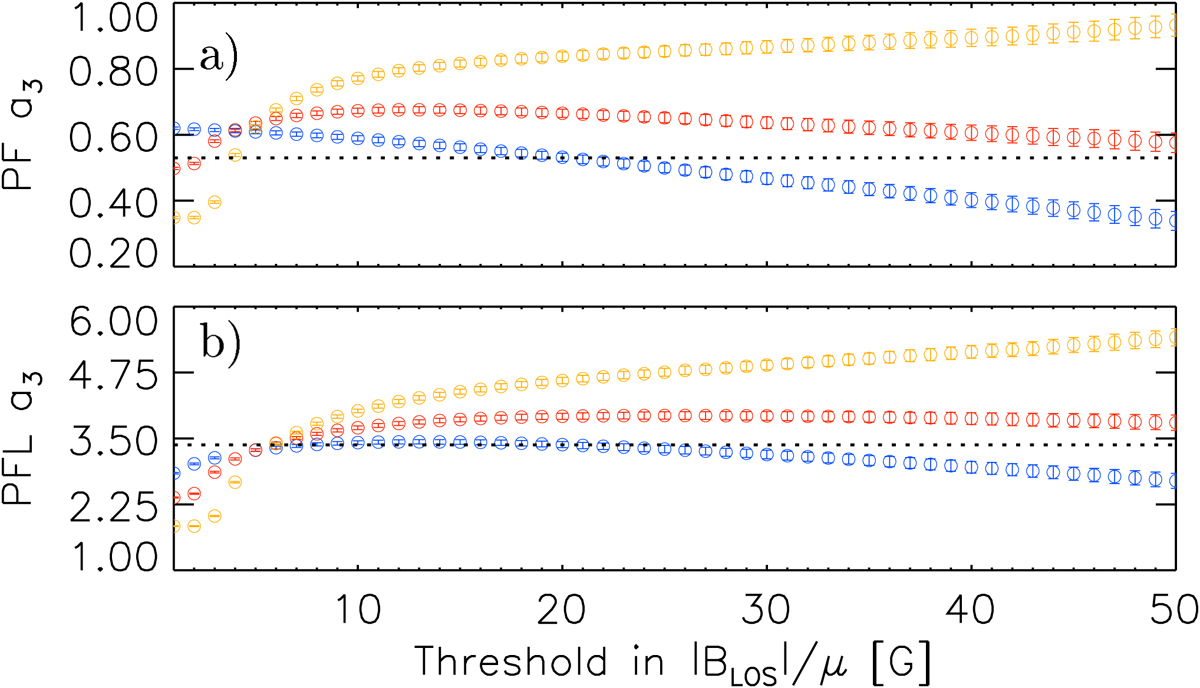
Parameters of the fits (Eq. (1)) as a function of the threshold in |BLOS|/μ for PF (panel a) and PFL (panel b) fits. The fits are performed on the curves derived by binning over |BLOS|/μ (blue), contrast values (yellow), and the bisector (red). The dotted line in each panel is the best fit parameter derived with the threshold of |BLOS|/μ = 20 G for the blue points.
Current usage metrics show cumulative count of Article Views (full-text article views including HTML views, PDF and ePub downloads, according to the available data) and Abstracts Views on Vision4Press platform.
Data correspond to usage on the plateform after 2015. The current usage metrics is available 48-96 hours after online publication and is updated daily on week days.
Initial download of the metrics may take a while.