Fig. 3.
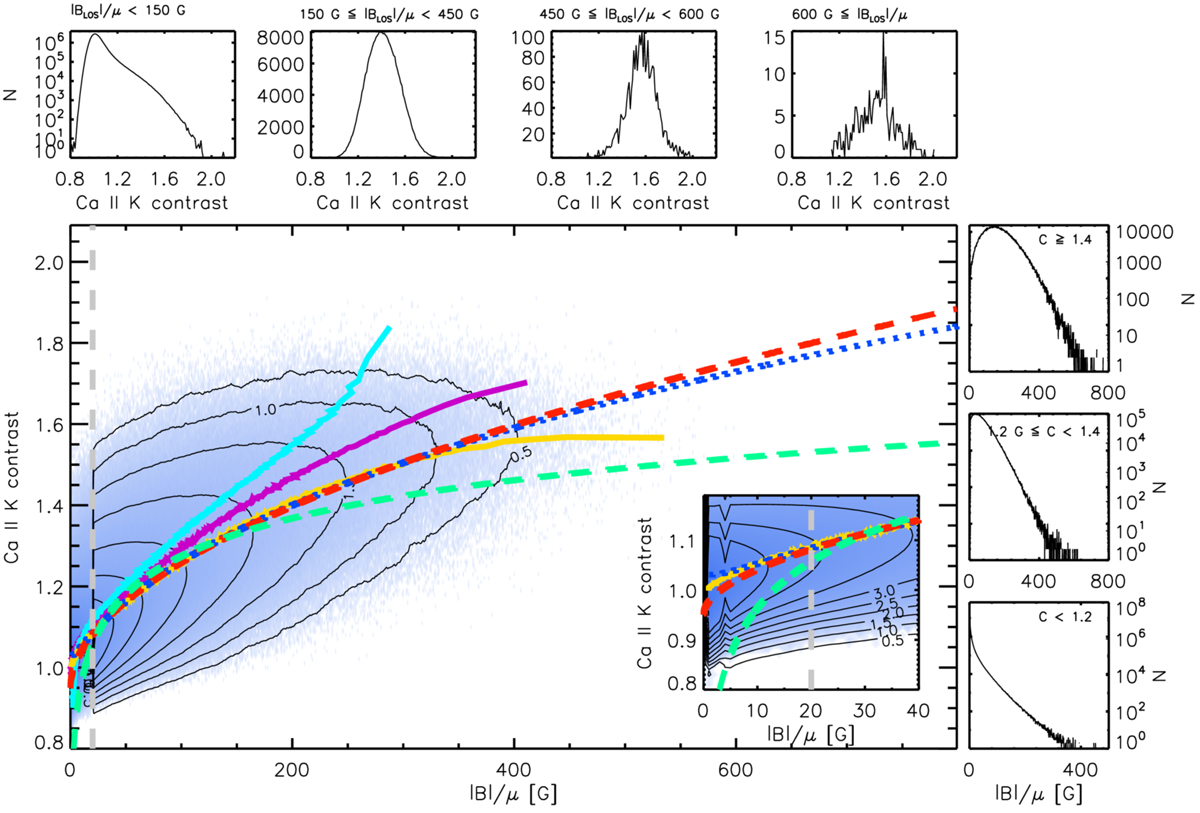
Ca II K contrast plotted against the unsigned LOS magnetic flux density divided by μ (|BLOS|/μ) for all pixel pairs (excluding sunspots) in all available images. The pixels are colour-coded denoting the logarithm of the number density within bins of 1 G and 0.01 in contrast. The contour lines give the logarithm of the pixel number density in intervals of 0.5. Curves show 5000-point running means (over |BLOS|/μ in yellow, over contrast in light blue, and their bisector in purple), as well as PF (red), PFL (blue), and LFL (green) fits on the binned curve over |BLOS|/μ (yellow curve). The vertical grey dashed line denotes the 20 G threshold in |BLOS|/μ. A magnified section for low |BLOS|/μ is shown at the lower right corner of the figure to illustrate the differences of the different fits over that region. Also shown are histograms of |BLOS|/μ within 3 ranges of contrast values (right) and histograms of Ca II K contrast for 4 ranges of |BLOS|/μ (top). The ranges used for the histograms are shown on the upper part of the corresponding sub-plot.
Current usage metrics show cumulative count of Article Views (full-text article views including HTML views, PDF and ePub downloads, according to the available data) and Abstracts Views on Vision4Press platform.
Data correspond to usage on the plateform after 2015. The current usage metrics is available 48-96 hours after online publication and is updated daily on week days.
Initial download of the metrics may take a while.