Fig. 2.
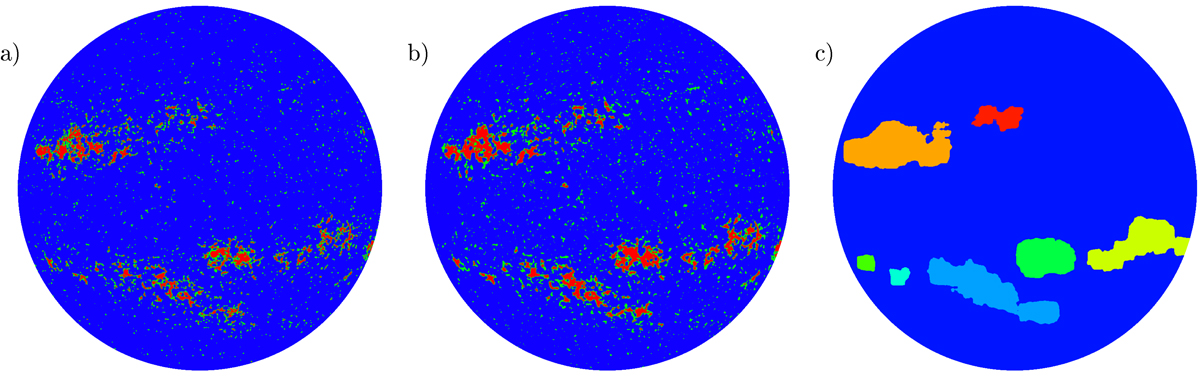
Segmentation masks of bright magnetic features derived from the observations shown in Fig. 1 by applying the two methods described in Sect. 2.3. Panel a: mask of magnetogram and panel b: mask of Ca II K image derived with Method 1, showing plage (red), network (green), and QS (blue). Panel c: mask of magnetogram derived with Method 2, showing individual activity clusters with different colours (the QS is in dark blue). The masks are shown prior to the exclusion of the sunspot regions.
Current usage metrics show cumulative count of Article Views (full-text article views including HTML views, PDF and ePub downloads, according to the available data) and Abstracts Views on Vision4Press platform.
Data correspond to usage on the plateform after 2015. The current usage metrics is available 48-96 hours after online publication and is updated daily on week days.
Initial download of the metrics may take a while.